We are writing about the two largest tech companies in the world today, Apple (NASDAQ:AAPL). and Microsoft (NASDAQ:MSFT). But why are we writing about these in particular?
The Government Pension Fund Global of Norway, also known as the Oil Fund, came out with its numbers today. Market value of the fund at the end of the year 2018 stood at USD 965 billion or NOK 8256 billion, down by 6.1 per cent from a year before. The Annual Report suggests that Microsoft has taken over Apple's place as the largest share in the Oil Fund.
At the end of 2018, the fund had invested USD 7.58 billion or NOK 64.72 billion in the software giant or 1.2 per cent of Microsoft shares. It is above Apple which holds second place with USD 7.35 billion or NOK 62.74 billion.
The technology giants dominate the top list of the oil fund's largest stock holdings. In Google's owner Alphabet (NASDAQ:GOOGL), the fund had $ 57.63 billion, while the stock of Amazon (NASDAQ:AMZN)'s trading company Amazon was $ 54.77 billion. The investments in Microsoft and Amazon contributed most to the fund's return in 2018.
The technology sector generated a return of minus 5.3 per cent in the fund in 2018. Technology, with 12.6 per cent of the portfolio, was the third largest sector in the fund, behind finance and industry with 23.7 and 12.9 per cent respectively.
Why could this be significant? The Oil Fund was established in 1990 to invest the surplus revenues of the Norwegian petroleum sector. It owns 1.3 % of global stocks and shares, making it the world’s largest sovereign wealth fund. With 2.33 per cent of European stocks, it is the largest stock owner in Europe.
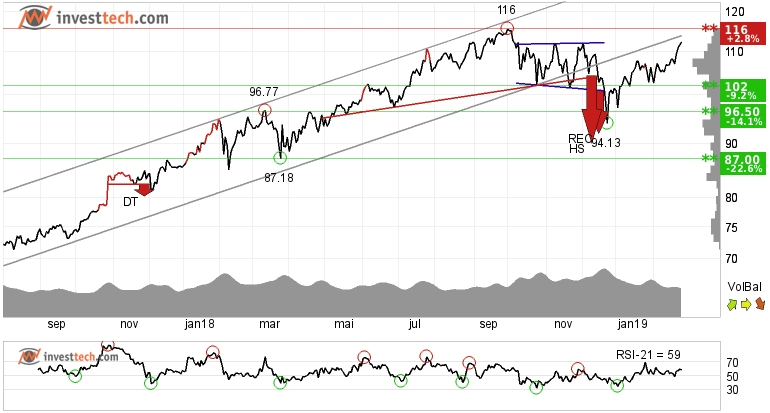
Microsoft Corporation, Close: 112.36

Microsoft broke the floor of the rising trend channel around middle of December. It dived further down after giving sell signal from two price formations in the medium term. A little short from its downside target, the stock price reacted upwards and broke above its resistance of 102 dollars.
The short term volume balance indicator is turning positive which is shown as the left-most rising green arrow in the bottom right corner of the chart. This means that volume tops corresponds well with rising price and vice versa. RSI is above 70 after a good price increase the past weeks and suggests the stock has strong positive momentum.
The stock is currently trading very close to its rising trend channel and only a little shy of its all time high at 116 dollars on the closing basis. On the other hand, the shorter term graph suggests that the stock has broken above its resistance at 112 dollars. If the stock manages to break and close above the 116 level, it will indicate a buy signal. On the downside there is support around 107 and 103 dollars.
Investtech's outlook (one to six months): Weak Buy
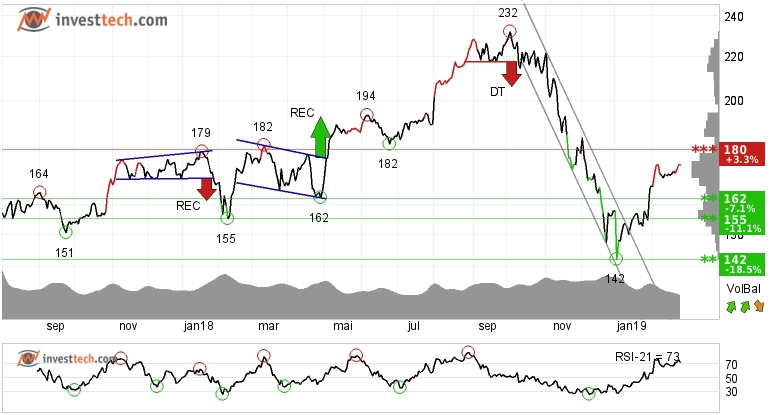
Apple Close: 174.33

Apple has broken the falling trend channel in the medium term and reacted strongly up. The stock had fallen almost 39 per cent from its top at 232 dollars made in early October and fell down to as low as the 142 level before correcting up.
For the time being, it is difficult to say anything about the future trend direction. However, rising tops and rising bottoms suggests that a new trend may be under construction. The stock is approaching resistance at dollar 180, which may give a negative reaction. But if it manages to close above this level, it may initiate new buying in the stock.
Positive volume balance, with high volume on days of rising prices and low volume on days of falling prices, strengthens the stock in the short term. RSI above 70 shows that the stock has strong positive momentum in the short term. Taking into account these positive factors, the stock is assessed as technically weak positive in the medium term. The stock is trading above the resistance of 170 in the short term. Hence this could be a stop loss level for the short term players. There is support around 162 and 157 dollars on the closing basis.
Investtech's outlook (one to six months): Weak Buy
Note: Exchange rates as per Feb 27, 9:58 AM UTC. Data taken from Wikipedia, NISM website and e24.no.
The analyses are based on closing price as per February 26, 2019
Disclaimer: All analyses used herein are subjective opinions of the author and should not be considered as specific investment advice. Investors/Traders must consider all relevant risk factors including their own personal financial situation before trading.
