The markets opened after the holiday season with a relatively quiet trading scene. The euro managed to post some gains on the last trading day of the year, as the U.S. dollar weakened into the final trading hours.
The weaker greenback led to the commodity markets holding their gains into the 2017 close. Geo-politics was largely stable over the week and did not impact the market sentiment by much. Trading is expected to remain light today ahead of a busy week starting from tomorrow.
On the economic calendar today, activity is slightly quiet. In the Eurozone, the Italian, French, German and the Eurozone final manufacturing PMI figures are expected to be released. No major surprises are expected as economists expect the final manufacturing PMI to remain steady at 60.6 same as the month before.
In the UK, the manufacturing PMI for December is expected to remain slightly weaker at 58.0 compared to 58.2 previously. In the U.S. trading session, the final manufacturing PMI is expected to show a steady print of 55.0. This comes ahead of the U.S ISM manufacturing PMI due on Wednesday.
EUR/USD Intra-Day Analysis

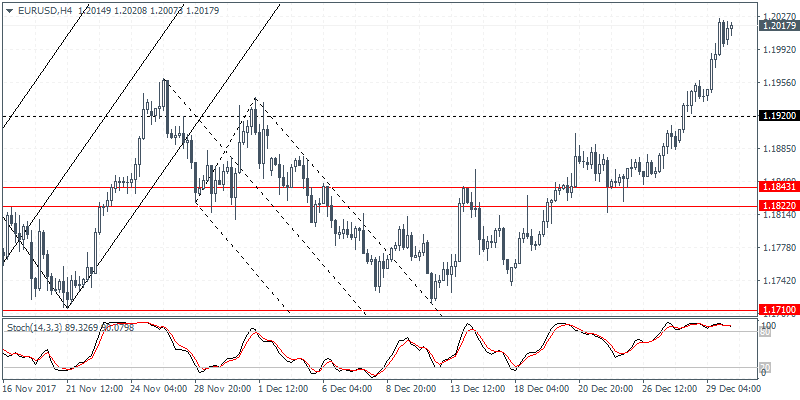
EUR/USD (1.2017):The EUR/USD rallied to a 3-monh high on an intraday basis on Friday closing in at 1.1997. The common currency maintained the gains as it opened on Tuesday near the same levels. In the short term, we expect that the EUR/USD is likely to maintain the upside momentum. However, consolidation is expected as price action approaches the 1.2000 - 1.2050 handle. At the time of writing, EUR/USD is seen trading near the highs. We expect to see short term correction in prices taking place. Support at 1.1920 remains the initial support to the downside, followed by a steeper test of support at 1.1843 - 1.1822.
USD/JPY Intra-Day Analysis

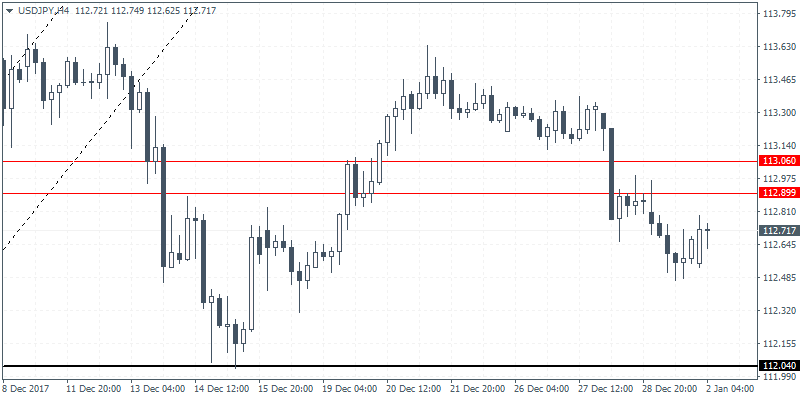
USD/JPY (112.71):The USD/JPY posted declines on Friday although the U.S. dollar is looking to pare some of those losses. In the near term, the modest recovery could see USD/JPY rallying back to the 112.90 - 113.00 level where resistance could be established. A reversal near this resistance could keep USD/JPY range bound. Support at 112.04 remains the key level to the downside. A breakout from this range is required in order for USD/JPY to establish further direction.
NZD/USD Intra-Day Analysis

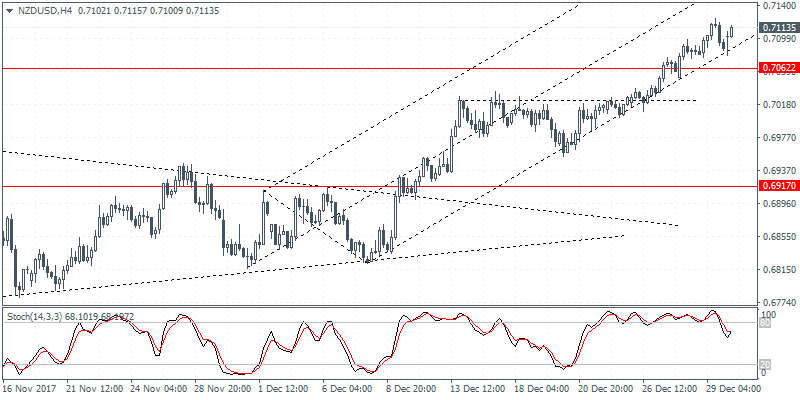
NZD/USD (0.7113):The New Zealand dollar rallied to a 2-month high on Friday with early price action today suggesting that the currency pair is maintaining the bullish momentum. Further upside gains could be seen coming with the resistance level of 0.7160 likely to be tested. On the intraday chart, NZD/USD is seen bouncing off the lower median line which could keep prices supported. A breakout from the lower median line could however suggest a correction. Support at 0.7062 remains the first level of defence, failing which, NZD/USD could be seen correction to 0.6917.
