The markets were trading fairly subdued although the US dollar was seen easing back. Economic data over the day included the German ZEW economic sentiment rising to 17.0, beating estimates of 12.3. The Eurozone ZEW economic sentiment was however soft, rising just 31.7 falling below estimates of 32.4. Data from the US saw the building permits which increased 1.30 million, but housing starts remained sluggish at 1.18 million.
Looking ahead, the main event for the day will be the FOMC meeting. The Fed is expected to announce it balance sheet normalization at today's meeting while keeping interest rates steady. The Fed will also be releasing its dot plot giving fresh forecasts on GDP, inflation and interest rates. Later in the day, New Zealand GDP is expected to show a quarterly GDP growth rate of 0.8%.
EURUSD intraday analysis

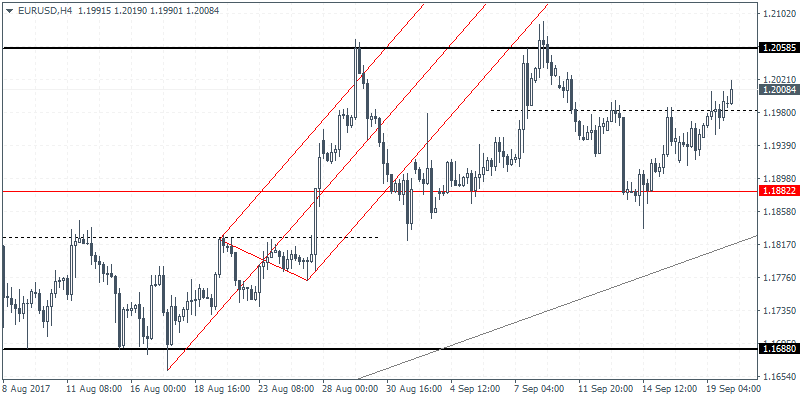
EURUSD (1.2008):The euro currency posted steady gains for the past five consecutive days with price action breaking above 1.1954. On the 4-hour chart, the inverse head and shoulders pattern that was formed has been validated and price action is likely to rally towards 1.2060 which marks the measured move. However, the rally to 1.2060 will be critical as it coincides with the resistance level that was previously tested. Failure to breakout above this level could keep EURUSD trading in the range. To the downside, price action will need to push lower towards the 1.1882 support level. A break down below this support will push EURUSD to new lows and possibly the correction. To the upside, 1.2200 will be the next target on a successful breakout above 1.2060.
GBPUSD Intraday Analysis

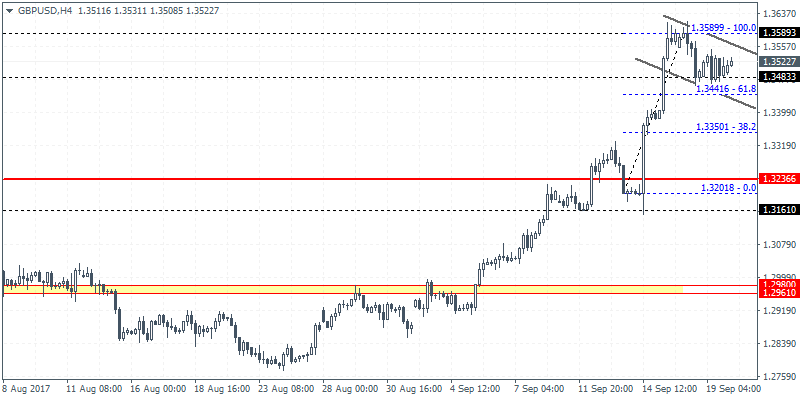
GBPUSD (1.3522):GBPUSD has been seen consolidating after price touched highs of 1.3566. The consolidation in price action suggests a bullish flag pattern that has formed. A range has also been established with support at 1.3483 and 1.3589. A breakout from this level will suggestfurther direction in the currency pair. The bias is for an upside breakout. This will potentially suggest further gains to come with theprice likely to target 1.3670 followed by 1.3830. In the event that the bullish flag fails, we can expect the downside to test 1.3236.
XAUUSD Intraday Analysis

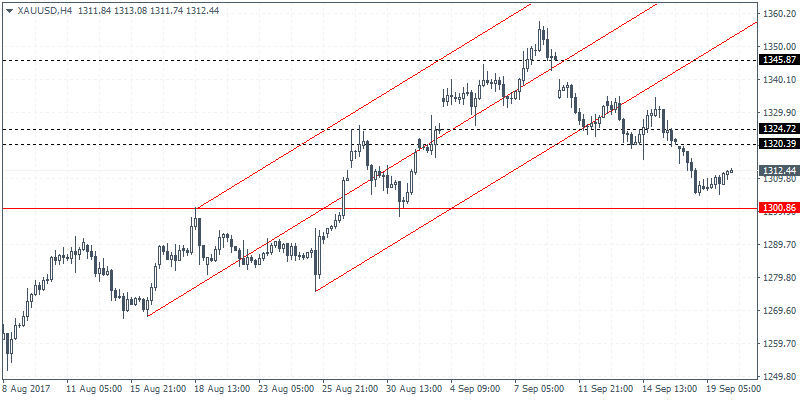
XAUUSD (1312.44): Gold prices were slightly bullish yesterday, but price action suggests cautious trading. The modest reversal off the lows near 1305.00 suggests a minor correction to the upside. Resistance is seen at 1320 - 1324 which will need to be breached in order for further gains to be logged. A breakout above this resistance will signal a move towards 1345.87. However, in the event that gold prices fail to break the resistance, the downside could see gold prices falling to 1300.00 support level.
