Yesterday, a strong risk off sentiment sent the yen and gold prices higher, while the EUR/USD remained largely flat. GBP/USD gave up its gains midway and turned bearish. Today's FOMC meeting minutes are likely to renew or reverse the prevailing trends in the markets, depending on the market reaction to the event. For the moment, $1200 looks elusive for gold as price action could see a move back to $1250.
EUR/USD Daily Analysis

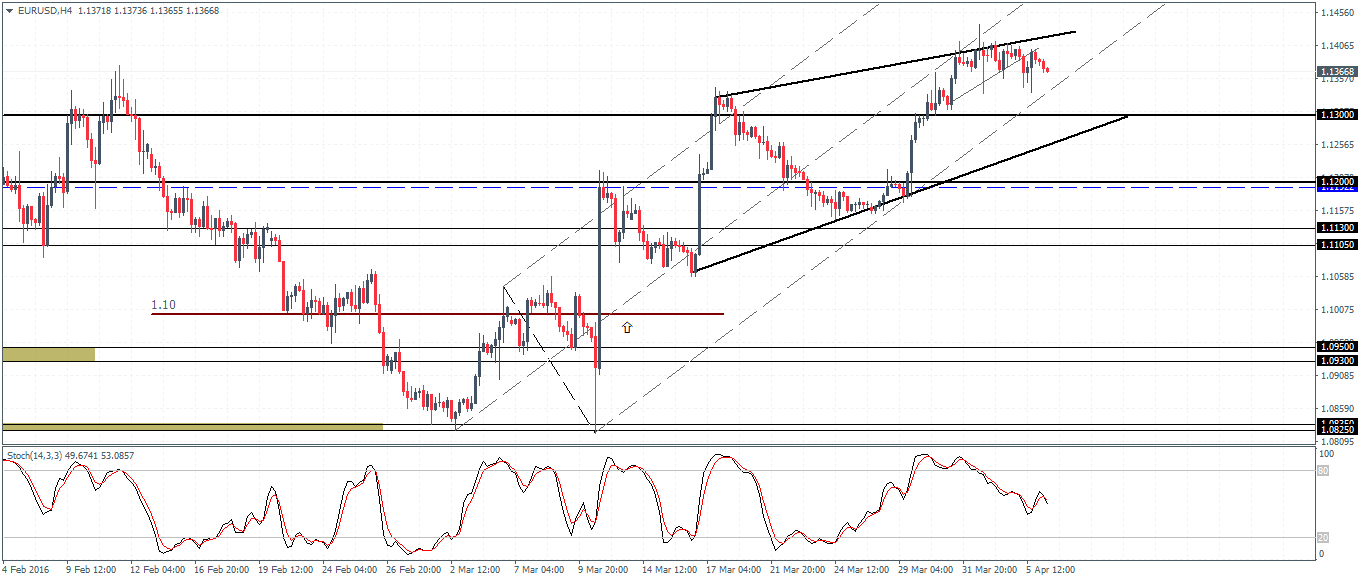
EUR/USD (1.13): EUR/USD continues to form small-bodied candlesticks near the top end of the recent rally. The current pause is likely to see some consolidating ahead of the uptrend being resumed. 1.130 broken resistance could be tested for support ahead of further upside to 1.147, while a dip below 1.13 could see EUR/USD test the lower support at 1.120. With prices breaking out from the modest rising wedge pattern, we can expect the dip to 1.13, with further downside likely on a break below this resistance and a continuation to the downside.
USD/JPY Daily Analysis

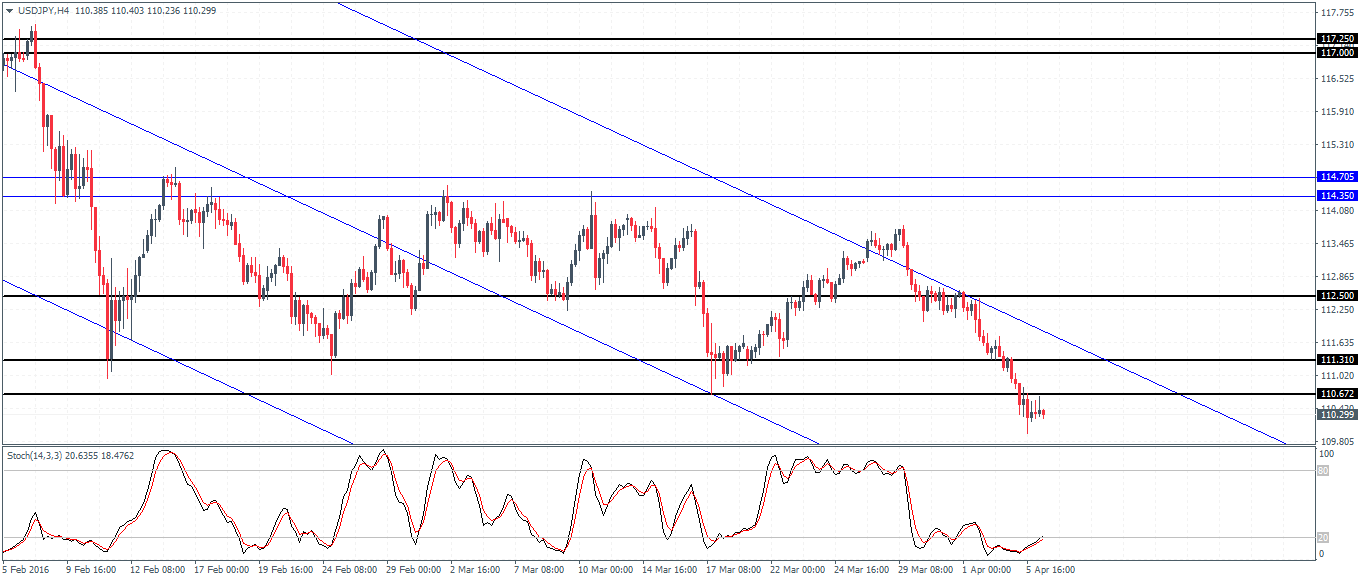
USD/JPY (110.3): USD/JPY continues its bearish trend with rather strong momentum. Prices remained biased to the downside with a close below 110.672 yesterday, and any potential upside moves in prices could be met with resistance. To the downside, 110.5 will be the next level of interest ahead of a longer-term decline to 109.5 region. It is ideal to keep an eye on the daily candlesticks for indication of any potential pullbacks to the current declines.
GBP/USD Daily Analysis

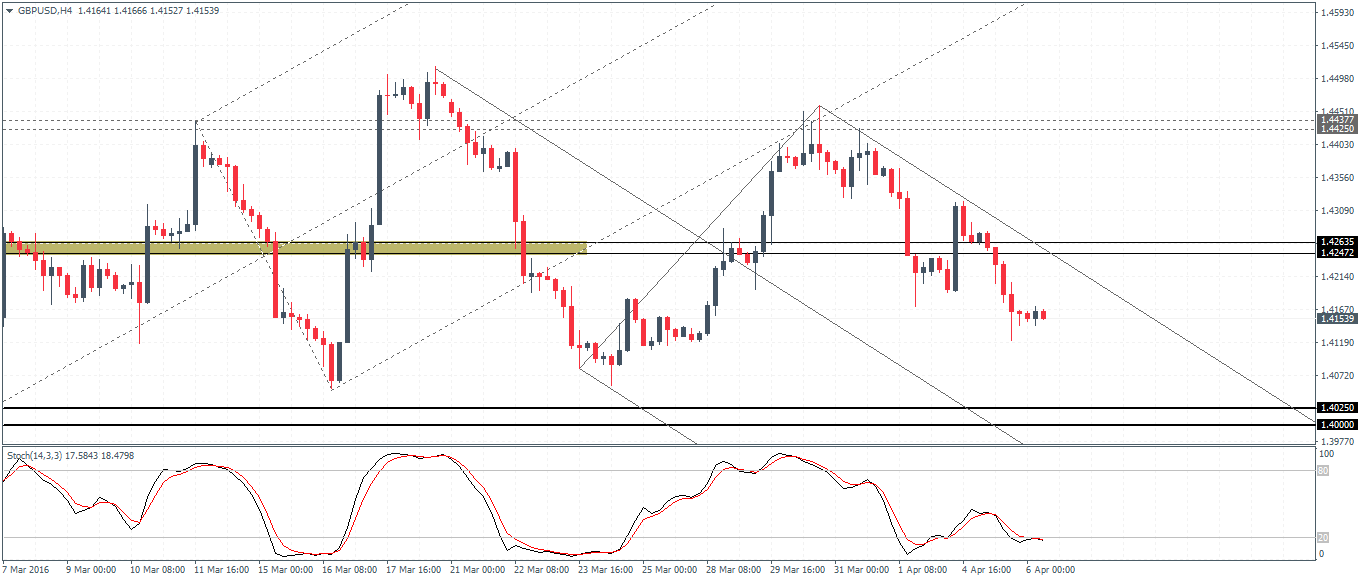
GBP/USD (1.41): GBP/USD is now trading below the minor resistance of 1.426 - 1.424. Yesterday's price action erased the gains from the previous day with a bearish engulfing pattern, indicating a continued downside in prices. Any pullbacks are likely to see the broken support/resistance at 1.426 - 1.424 being retested ahead of further declines towards 1.4025 - 1.40.
Gold Daily Analysis

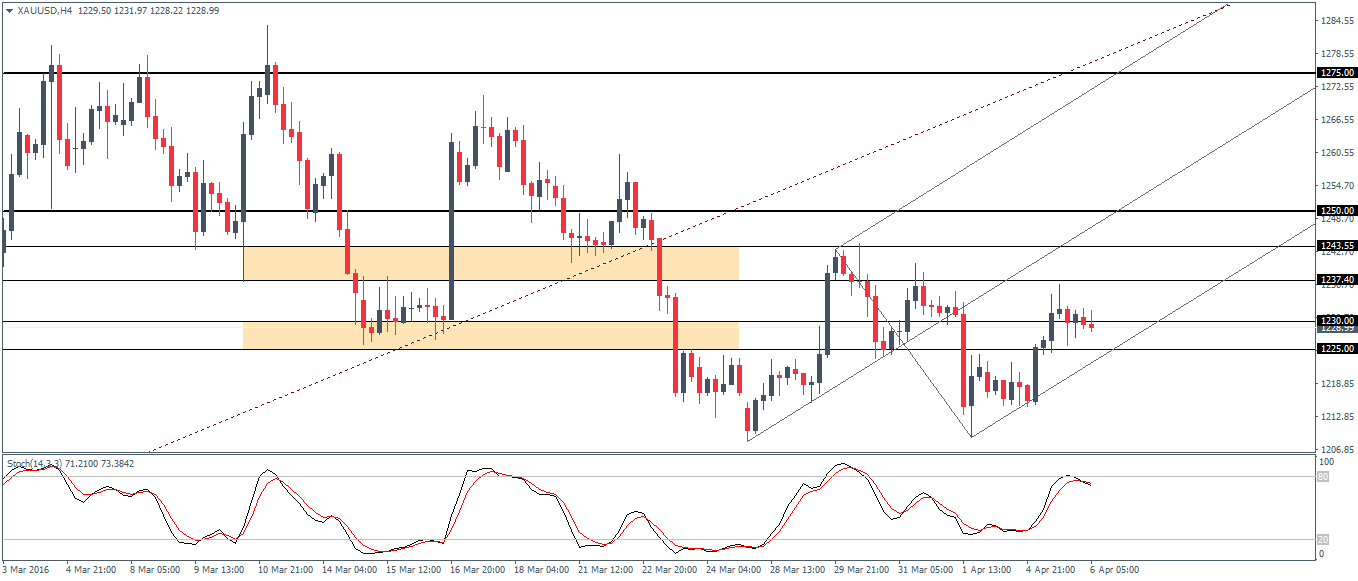
XAU/USD (1228): Gold prices are looking to move up again following yesterday's bearish close. So far price action has formed a bullish engulfing pattern, but a daily close will confirm this bias. The new rising median line on the chart shows gold back at one of the support/resistance levels, currently in the 1230 - 1225 zone. A break higher will see further upside to the 1243 - 1237 zone. Overall, gold prices are likely to stay limited below 1250 and 1215 levels.
