Get 40% Off
These stocks are up over 10% post earnings. Did you spot the buying opportunity? Our AI did.Read how

Market Stability: Are We There Yet?

Published 03/13/2020, 01:34 AM
Updated 07/09/2023, 06:31 AM

WORLD MARKETS


Further to my last post, world markets continued to plunge in Thursday's trading, as shown below.
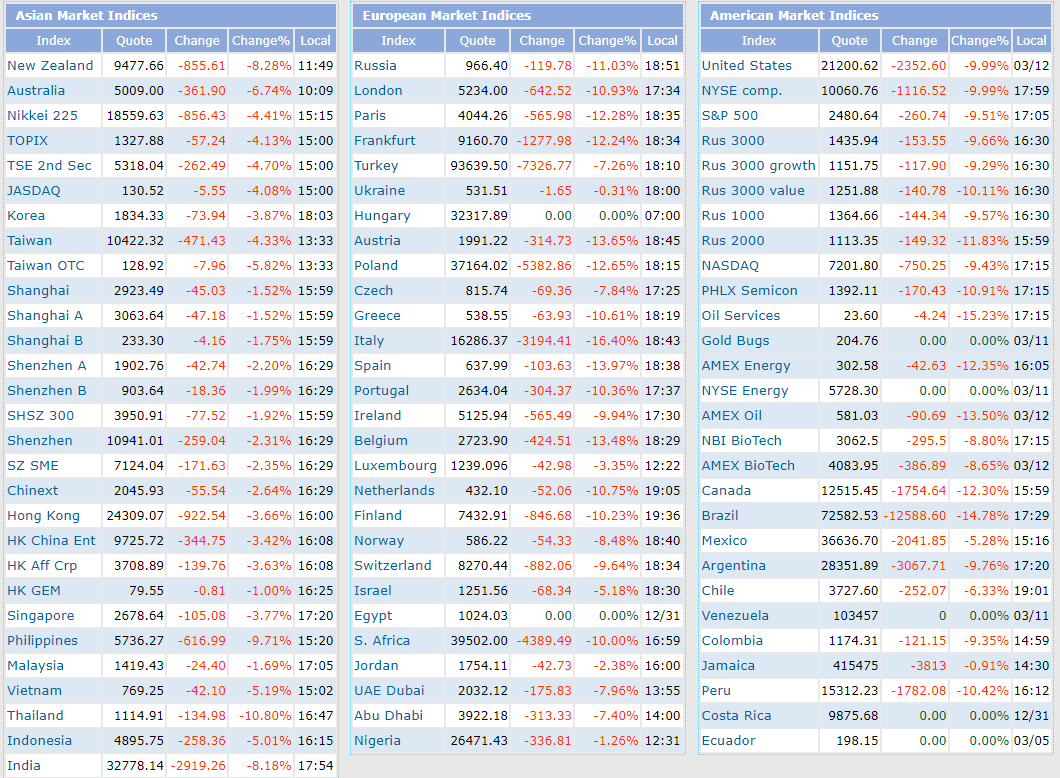
World Markets

S&P E-MINI FUTURES INDEX


The S&P 500 E-mini Futures Index (ES) is currently trading after-hours (8:00 pm ET) near its Thursday close, as shown on the monthly chart below.

Price is caught around/near major support, comprised of:

  • the -1.75 deviation level of the long-term uptrending Andrew's Pitchfork channel taken from the 2009 low to 2020's high (2400ish)
  • the 60% Fibonacci retracement level taken from the 2016 low to 2020's high (2400)
  • the 40% Fibonacci retracement level taken from the 2009 low to 2020's high (2350)
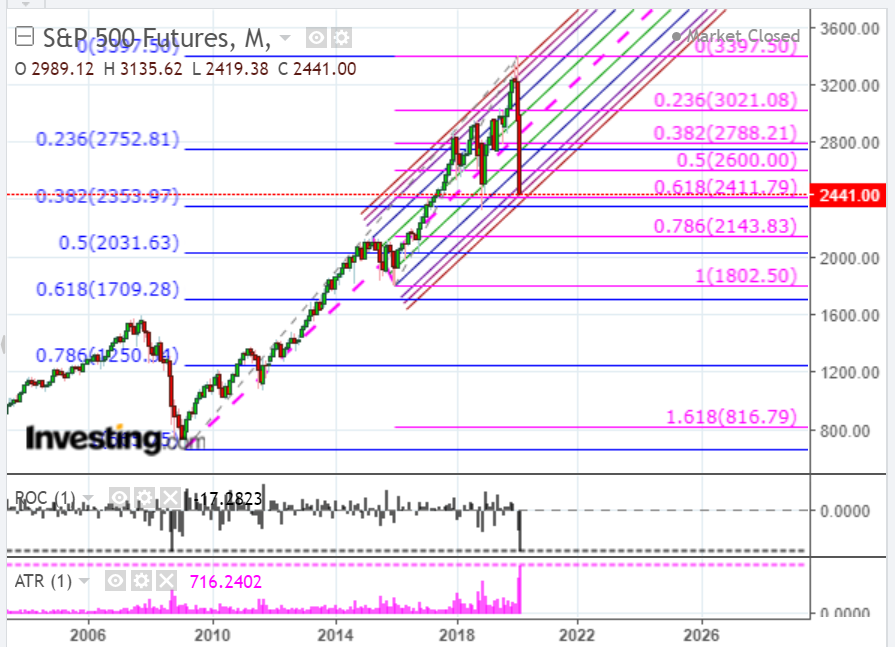
Price has clearly broken below the bottom of the the channel around 2750, which usually signals that a new bearish trend will form.
The Rate-of-Change (ROC) and Average True Range (ATR) technical indicators have both spiked to new all-time extreme levels (I've shown them both with an input value of one period in histogram format to illustrate this clearly).
Such extreme spikes generally indicate that capitulation is near and that price may begin to stabilize soon.
We may see lower prices, however, in the meantime.

S&P 500 Futures Monthly Chart

SPX:VIX RATIO


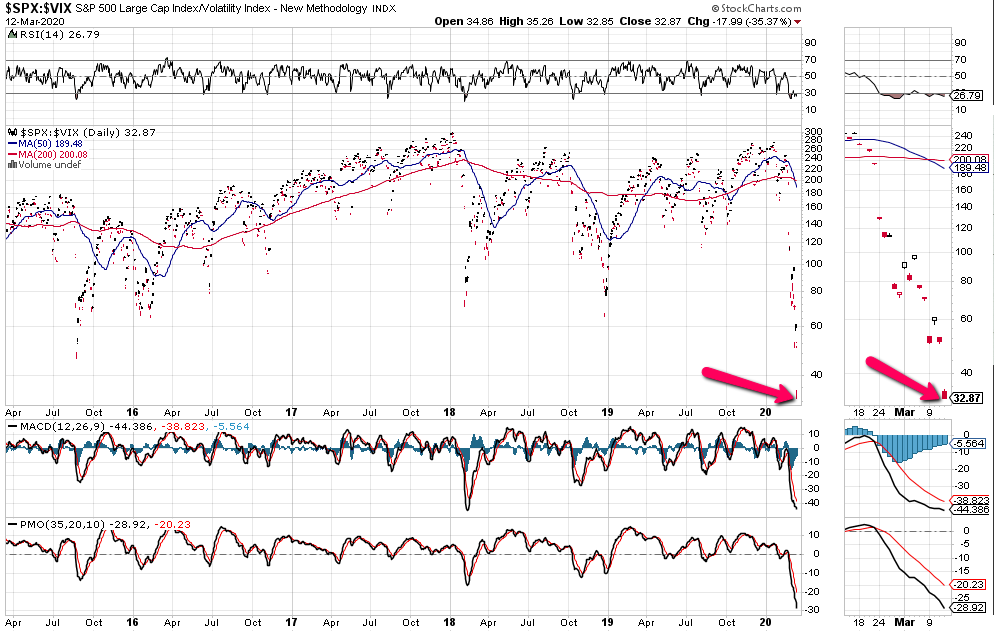
The SPX:VIX ratio has fallen off a cliff and closed at 32.87 (a level last seen in 2009), as shown on the following daily chart.

The moving averages have formed a new bearish Death Cross, signalling more weakness ahead for the SPX.

If that crossover holds, look for extreme levels of volatile price swings in both directions, with possible lower prices on the SPX around 2350ish, until we see a sustainable bounce, with conviction, and a possible retest of the lower edge of the channel around 2750.

A drop and hold below 2350 could produce a catastrophic spike down to somewhere between 2140 and 2030, or lower. SPX/VIX Daily Chart
3rd party Ad. Not an offer or recommendation by Investing.com. See disclosure here or remove ads .

U.S., GERMAN And CHINESE FINANCIAL SECTORS


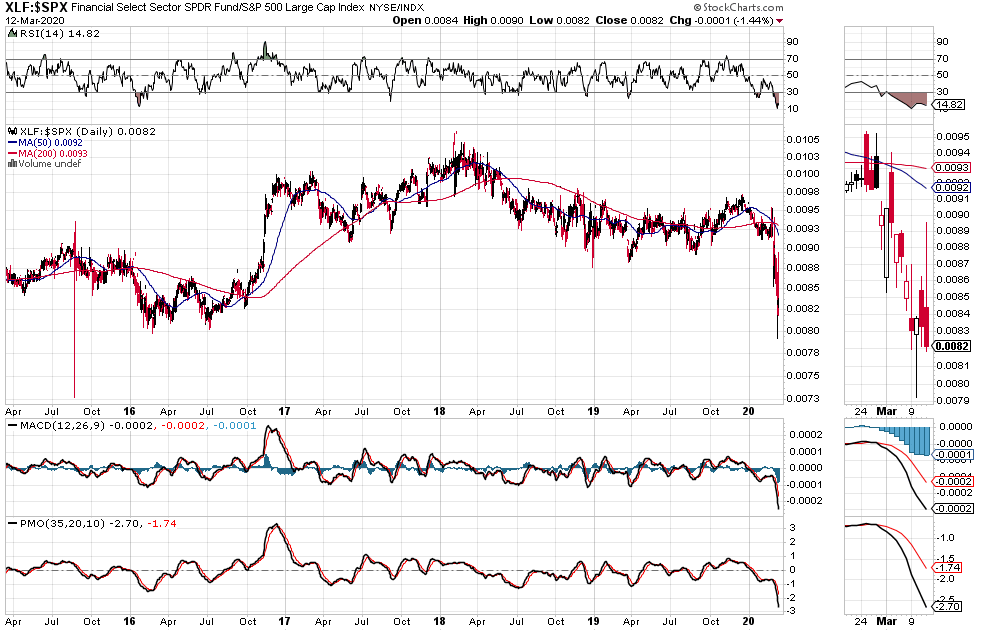
Finally, keep an eye on the XLF:SPX ratio daily chart. It's now down near a 5-year major support level and the moving averages have formed a new bearish Death Cross, signalling more weakness for the Financial Sector (XLF).

Price is attempting to stabilize the last several days, but if it drops lower, it could drag the SPX down, as well. XLF/SPX Daily Chart
And, keep an eye on the next two ratios.

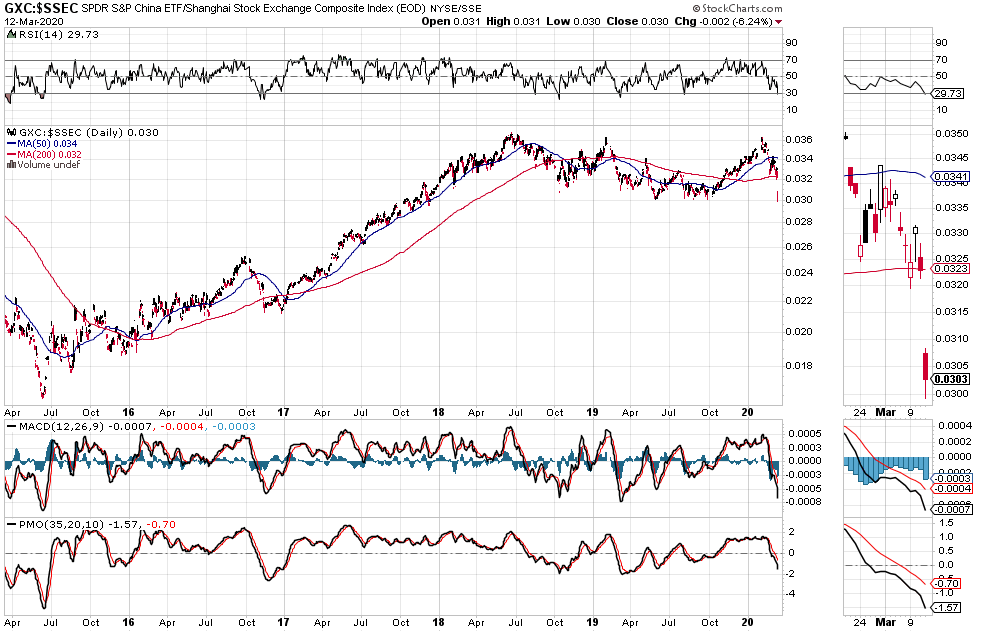
The first is the EUFN:DAX ratio (the European Financial Sector ETF compared with the German Index, DAX), and the second is the GXC:SSEC ratio (China's Financial Sector ETF compared with the Shanghai Index, SSEC).

They're also both at their respective major support levels.

A drop and hold below current price will likely drag their respective indices down, as well.
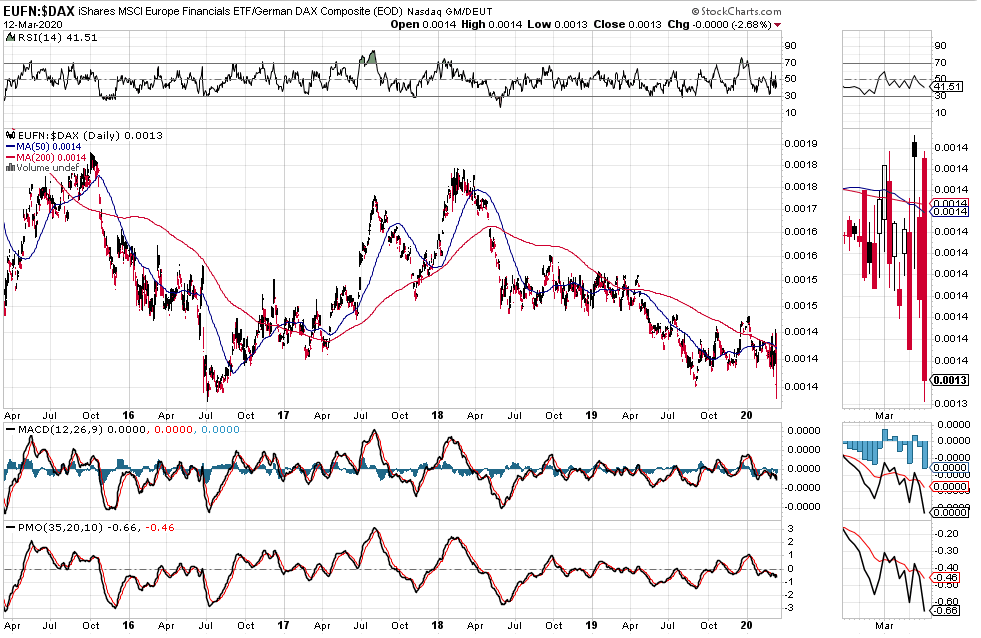
EUFN/DAX Daily Chart

GXC/SSEC Daily Chart

BOTTOM LINE


If the above-referenced three financial sectors remain much weaker than their index counterparts, then we'll likely see more weakness in world markets, in general, along with heightened volatility, notwithstanding a variety of monetary and fiscal stimulus measures currently being deployed or planned by central bankers and world governments.

As I mentioned in my last post, 2008/09 was a bank financial crisis.

This is an economic crisis, health crisis, and global supply-chain crisis, and one that is multiplying every several days in depth and breadth...not easily or quickly resolved by monetary and fiscal stimulus, particularly if they're not adequately and correctly targeted.

If conditions persist and market weakness persists, this may also become a bank financial crisis.

Watch for drops in consumer confidence and spending, along with rising unemployment numbers, for possible clues in this regard.

3rd party Ad. Not an offer or recommendation by Investing.com. See disclosure here or remove ads .

Latest comments

When I add this forward thinking warning to your April 15th revelation of support kevels on the SPX and its dependent indices I see the huge calue of applying the Dr Andrews Pitchfork tool which in turn employs pivot points in order to acertain probable direction. I knew there was a valuable reason I signed onto your articles.https://www.forexboat.com/andrews-pitchfork-mt4-indicator/
(sp. “value”)
Risk Disclosure: Trading in financial instruments and/or cryptocurrencies involves high risks including the risk of losing some, or all, of your investment amount, and may not be suitable for all investors. Prices of cryptocurrencies are extremely volatile and may be affected by external factors such as financial, regulatory or political events. Trading on margin increases the financial risks.
Before deciding to trade in financial instrument or cryptocurrencies you should be fully informed of the risks and costs associated with trading the financial markets, carefully consider your investment objectives, level of experience, and risk appetite, and seek professional advice where needed.
Fusion Media would like to remind you that the data contained in this website is not necessarily real-time nor accurate. The data and prices on the website are not necessarily provided by any market or exchange, but may be provided by market makers, and so prices may not be accurate and may differ from the actual price at any given market, meaning prices are indicative and not appropriate for trading purposes. Fusion Media and any provider of the data contained in this website will not accept liability for any loss or damage as a result of your trading, or your reliance on the information contained within this website.
It is prohibited to use, store, reproduce, display, modify, transmit or distribute the data contained in this website without the explicit prior written permission of Fusion Media and/or the data provider. All intellectual property rights are reserved by the providers and/or the exchange providing the data contained in this website.
Fusion Media may be compensated by the advertisers that appear on the website, based on your interaction with the advertisements or advertisers.
© 2007-2024 - Fusion Media Limited. All Rights Reserved.