
EUR/USD
Two spinning tops and a large upper wick are left on the daily charts as a warning to those committed to the upside. These patterns take the shape of a triangular formation on intraday charts with price action glued to the resistance line. Still flirting with the 27th December spike high, the price is not so well supported by the oscillators readings. These have crossed slightly below their center lines as a result of the lateral trading, and there is now a risk of filling the void let by the rapid ascending move from last week is possible with a dip below 1.3850 en route to 1.3750. The weekly pivot (1.3832) coincident with the Feb 28th high is likely to underpin the rate and offer a short-term scalp opportunity. As a result of the consolidative tone which from yesterday, the daily pivot point's S and R levels are extreme narrow and would not act as obstacles one the price picks some volatility again.
Resistance: 1.3911; 1.3932; 1.4150; 1.4258
Support: 1.3832; 1.3750; 1.3700; 1.3650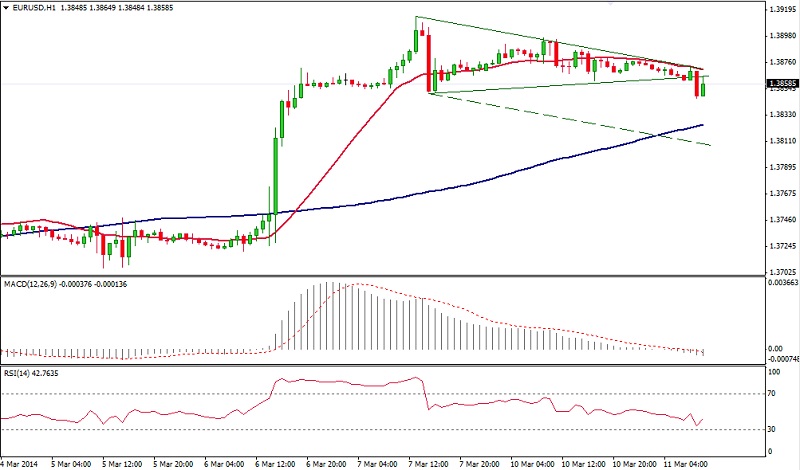 EUR/USD Hour Chart" title="EUR/USD Hour Chart" width="800" height="449">
EUR/JPY
The bearish divergence situation detected on intraday charts lost its appeal a sort trading opportunity, now that oscillators are printing sideways along their center lines. The abated upside momentum can be seen as a pause in a continuation scenario, so risks are on both directions today. Rising 60 pips per day, the support trend line from last week's low is catching up with price. It remained untouched for the present week, and yet it can be called to live and offer the needed technical cushion to start a new leg to the upside. In such a case, upside resistances looming are the December high around 145.60, well above 200 pips from now but with little obstacles on the way. Above that level, an impressive wall is visible on a monthly chart offering an open invitation to a 2000 pips escalation in this yen cross. So abandon your short-view in case of piercing above these resistances as this may indicate higher attempt at 145.00 – 155.00 regions.
Alternatively, considering that we have recovered 61,8% of the January plunge and that buying appears to dry up, the EURJPY has scope to reverse the intermediate trend and reverse lower anew.
Resistance: 144.50; 145.00; 145.60; 151.00
Support: 142.08; 141.50; 140.00; 139.08 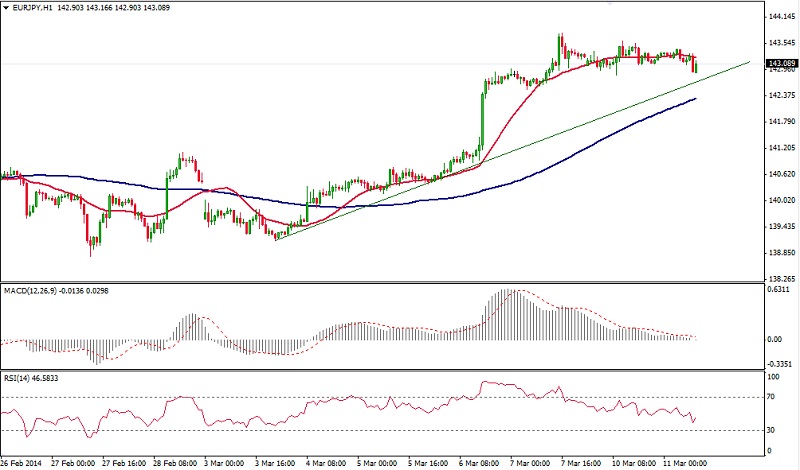 EUR/JPY Hour Chart" title="EUR/JPY Hour Chart" width="800" height="449">
GBP/USD
Being well offered on every topside attempt, the Cable traveled to the lower boundaries of its sideways range with yet another sharp pullback. The still erratic price action continues to be contained within the confines of a lateral range. Judging by the price action, the prevailing upward trend is not anymore technically operative. Intraday oscillators plunged below its center lines and entered oversold areas not seen since end of February on the hourly charts. This is a bearish omen to take into account for today's session. The almost vertical session yesterday was followed by a small sideways consolidation, which has the potential to become a short-term continuation flag pattern if broken down in the next hours, with scope for 1.6500. Just below, at 1.6450 we could start seeing interest to participate in buying corrective dips.
On the upside, the broken channel support could cap the price action above the eminent trend line cross as seen in the 1-hour chart.
Resistance: 1.6670; 1.6718; 1.6792; 1.6840
Support: 1.6596;L 1.6548; 1.6474; 1.6390 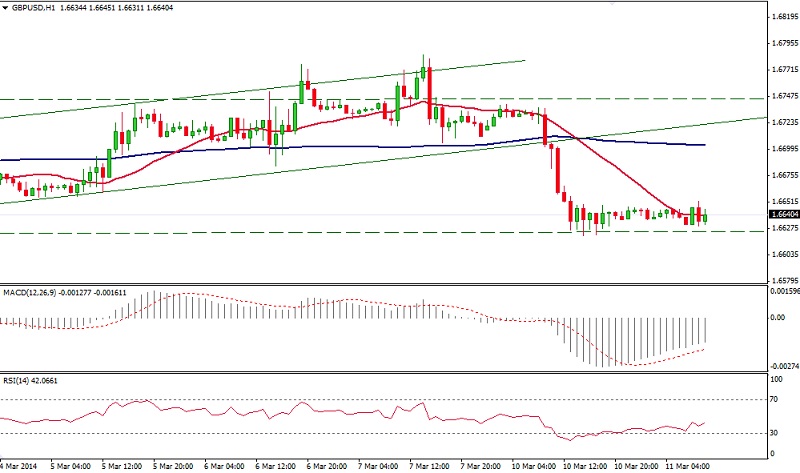 GBP/USD Hour Chart" title="GBP/USD Hour Chart" width="800" height="449">
USD/JPY
The pair has been locked within the range of the NFP-induced 1-hour candlestick and is currently hesitating where to go next. Having tested the 103.70 mark on Friday and corrected sharply thereafter, the USD/JPY has managed to regain some of those ticks back by climbing above 103.00 in today's Asian trade. A direct loss of this round number though would suggest the whole affair has been a false upside break with a possible return below 102.50.The two spinning top candlesticks looming on the daily chart are indicative of an abated momentum and also add credence for a turn in the tide. Would the pair manage to sustain itself well above 103.00, then the 104.00 and 104.50 handles could be reached quite easily since there are not many obstacles on the way North.With the Bank of Japan policy meeting on the agenda today caution is likely to prevail.
Resistance: 139.00; 139.30; 141.46; 142.40
Support: 138.30; 138.00; 137.50; 137.00 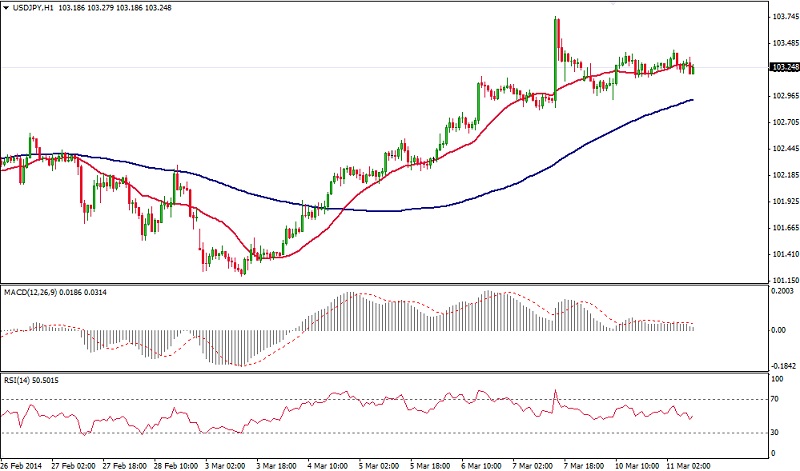 USD/JPY Hour Chart" title="USD/JPY Hour Chart" width="800" height="449">
AUD/USD
The established trend line from last weeks low -coincident with the 200 SMA on the hourly chart- acted as a guide for the recent session. The sharp 100 pip descent move from Friday's peak still threatens to clear the round number 0.9000 on a continuation move. But the rounded bottom drawn on the hourly charts, accompanied by a similar behavior in the oscillators, opens the door for a recovery, at least a 50% reaction from the mentioned plunge. On the other side, fresh buying interest could revive the pair at 0.8980, the 61.8% retracement from the 0.9130 peak. A break of this technical cushion opens the scope to test the bulls at the start of the rally at 0.8890. A couple of acceleration trend lines drawn on the RSI should be used as a gauge for the momentum in the price series.
Resistance: 0.9050; 0.980; 0.9102; 0.9130
Support: 0.9000; 0.8980; 0.8890; 0.8760 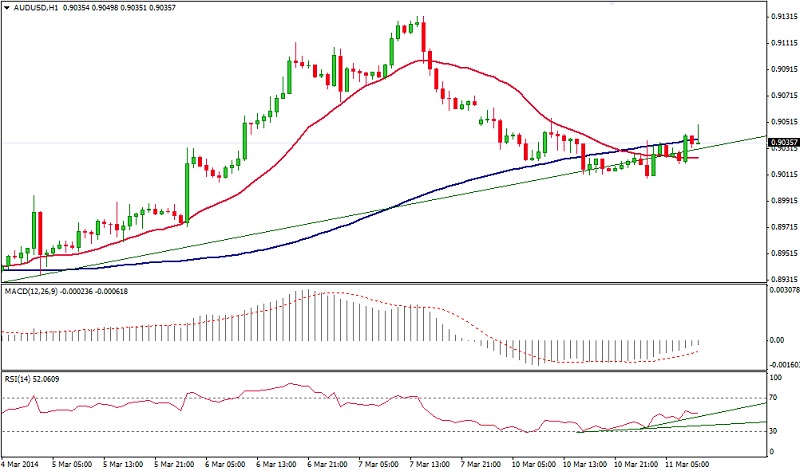 AUD/USD Hour Chart" title="AUD/USD Hour Chart" width="800" height="449">
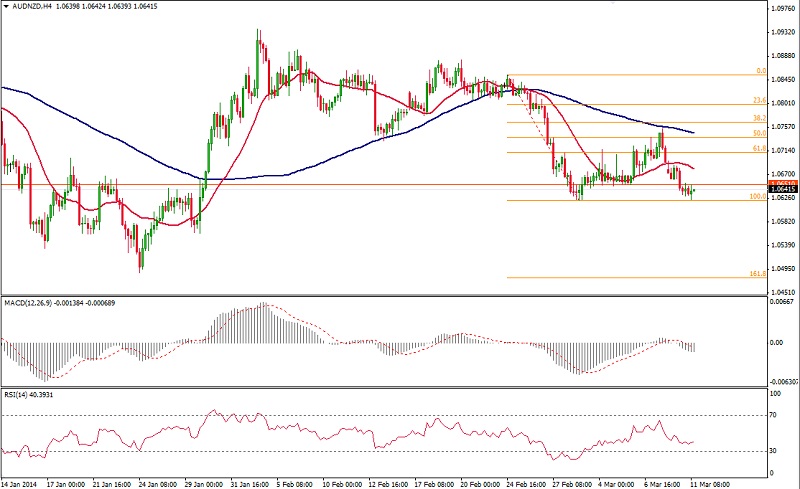
AUD/NZD
Having performed a 100% correction of the bumpy ascending move from last week, the Pacific cross now eyes 1.0620 with scope of further weakness towards 1.0580 and 1.0500, a Fibonacci 161.8% extension of the more pronounced down move from two weeks ago. But only a break of the January low would mean the prevailing trend – as seen in the daily charts- is still operative. The reaction from these lows still threatens to turn the tide and conquer higher levels. The cross is getting a lift from AUD flows which are in the process of correcting some of the outstanding performances seen in a plethora of pairs last week, while the NZD is still overextended to some degree. A correction in NZD based pairs would favour a rally in the AUDNZD cross. Therefore, closer attention should be put on the weekly pivot (1.0690) which can give some hints as to what is the bias for the next sessions.
Resistance: 1.0690; 1.0656; 1.0679; 1.0718
Support: 1.0617; 1.0594; 1.0555; 1.0500
 AUD/NZD Hour Chart" title="AUD/NZD Hour Chart" width="800" height="449">
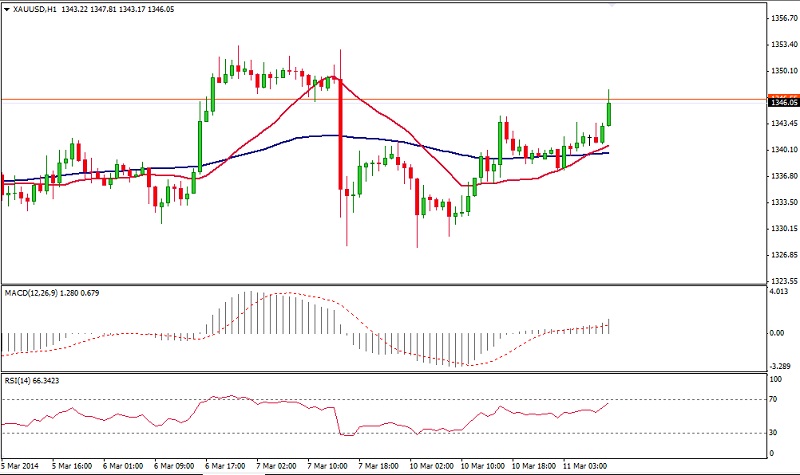
XAU/USD
Overnight, Gold added to their NFP-inspired losses from Friday but has so far managed to hold its own above the pivotal $1330 mark with a new break to the upside and way from the weekly pivot (1340). The daily charts show a gradual change in the supply and demand forces in the form of a triple bearish divergence with the RSI. On the intraweek charts, another reversal set-up, a potential double top formation with a minimum ultimate objective of 1305 is now threatened of not being confirmed with a break of 1330. A failure of these patterns would delete any vulnerability seen on gold charts and skew the probabilities to another rally from here. Recent shocking Chinese data helped to increase the appetite for safe haven assets including metals, which had already been in demand due to the on-going situation in Ukraine.
Resistance: 1340; 1352; 1365; 1377
Support: 1327; 1315; 1302; 1300
 XAU/USD Hour Chart" title="XAU/USD Hour Chart" width="800" height="449">
- English (UK)
- English (India)
- English (Canada)
- English (Australia)
- English (South Africa)
- English (Philippines)
- English (Nigeria)
- Deutsch
- Español (España)
- Español (México)
- Français
- Italiano
- Nederlands
- Português (Portugal)
- Polski
- Português (Brasil)
- Русский
- Türkçe
- العربية
- Ελληνικά
- Svenska
- Suomi
- עברית
- 日本語
- 한국어
- 简体中文
- 繁體中文
- Bahasa Indonesia
- Bahasa Melayu
- ไทย
- Tiếng Việt
- हिंदी
Market Outlook: USD/JPY Locked In Trading Range
Published 03/11/2014, 06:13 AM
Updated 02/21/2017, 08:25 AM
Market Outlook: USD/JPY Locked In Trading Range
Latest comments
Loading next article…
Install Our App
Risk Disclosure: Trading in financial instruments and/or cryptocurrencies involves high risks including the risk of losing some, or all, of your investment amount, and may not be suitable for all investors. Prices of cryptocurrencies are extremely volatile and may be affected by external factors such as financial, regulatory or political events. Trading on margin increases the financial risks.
Before deciding to trade in financial instrument or cryptocurrencies you should be fully informed of the risks and costs associated with trading the financial markets, carefully consider your investment objectives, level of experience, and risk appetite, and seek professional advice where needed.
Fusion Media would like to remind you that the data contained in this website is not necessarily real-time nor accurate. The data and prices on the website are not necessarily provided by any market or exchange, but may be provided by market makers, and so prices may not be accurate and may differ from the actual price at any given market, meaning prices are indicative and not appropriate for trading purposes. Fusion Media and any provider of the data contained in this website will not accept liability for any loss or damage as a result of your trading, or your reliance on the information contained within this website.
It is prohibited to use, store, reproduce, display, modify, transmit or distribute the data contained in this website without the explicit prior written permission of Fusion Media and/or the data provider. All intellectual property rights are reserved by the providers and/or the exchange providing the data contained in this website.
Fusion Media may be compensated by the advertisers that appear on the website, based on your interaction with the advertisements or advertisers.
© 2007-2024 - Fusion Media Limited. All Rights Reserved.