
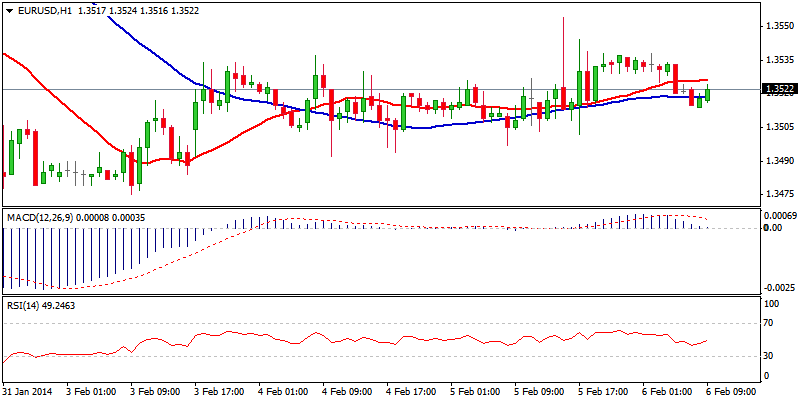
EUR/USD
The euro holds neutral near-term tone, fluctuating within three-day range, with spikes above range tops showing lack of strength for more significant action higher and attempt at pivotal 1.3580/1.3600 barriers. Neutral hourlies and still weak 4-hour studies, see scope for prolonged sideways movements, with today’s ECB release expected to trigger stronger action. Break above strong 1.36 resistance zone, daily 20/100SMA’s bear-cross; daily Tenkan-sen line and mid-point of 1.3738/1.3475 fall, would spark stronger rally and mark near-term bottom. Fibonacci 61.8% retracement at 1.3638, offers next barrier, ahead of 1.3680 and 1.3700. On the downside, violation of range floor at 1.35 zone, to open 1.3475 base and signal resumption of bear-phase from 1.3892, 27 Dec peak. Negative daily studies support bearish scenario for now.
Resistance: 1.3538; 1.3554; 1.3572; 1.3600
Support: 1.3492; 1.3475; 1.3457; 1.3435
 EUR/USD Hour Chart" title="EUR/USD Hour Chart" width="800" height="400">
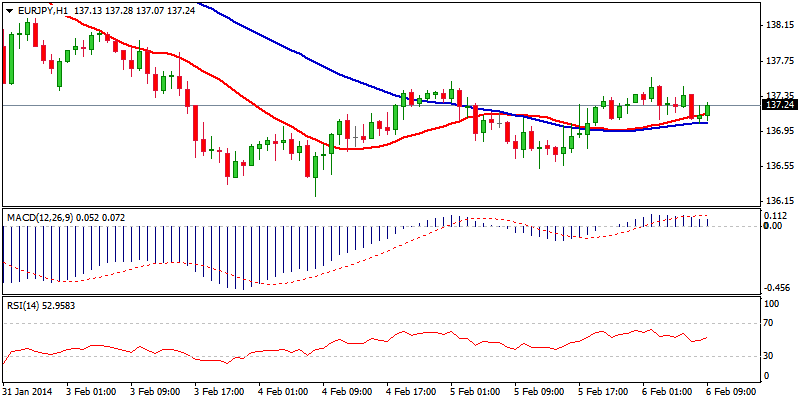
EUR/JPY
The pair trades within 100-pips consolidative range, as recovery attempt from fresh low at 136.21, is so far limited by 4-hour 20SMA and daily 100SMA at 137.55. Sideways movements keep hourly studies in neutral mode, while larger pictures show prevailing negative tone. This keeps the downside at risk for resumption of larger downtrend from 145.67. Break below 136.21/00, initial supports, to open 135.50, Oct 2013 tops and psychological 135 support in extension. On the upside, 138 zone offers good resistance and only clear break here would signal stronger recovery and confirm near-term base.
Resistance: 137.55; 138.13; 138.65; 139.00
Support: 137.00; 136.53; 136.21; 136.00
 EUR/JPY Hour Chart" title="EUR/JPY Hour Chart" width="800" height="400">
GBP/USD
The Cable entered near-term consolidative phase, as the fourth wave off 1.6255 low, lacked strength for extension towards its ideal cap at 1.6400. Price action is congested between 1.6255 and 1.6343 range, with neutral hourly tone confirming sideways mode. However, prevailing negative tone on larger timeframes keeps the downside pressured and sees scope for resumption of larger bear-trend from 1.6668 peak, after completion of consolidative phase. Break below 1.6255 support to open 1.6215, daily cloud base and 1.6165, Fibonacci 61.8% retracement of 1.5853/1.6668 upleg. Only bounce through 1.64 hurdle, also Fibonacci 38.2% of 1.6623/1.6255 and 4-hour 55SMA, would delay immediate bears and open 1.6440, 50% retracement and 1.6480, 61.8% instead.
Resistance: 1.6343; 1.6400; 1.6440; 1.6480
Support: 1.6255; 1.6236; 1.6215; 1.6165 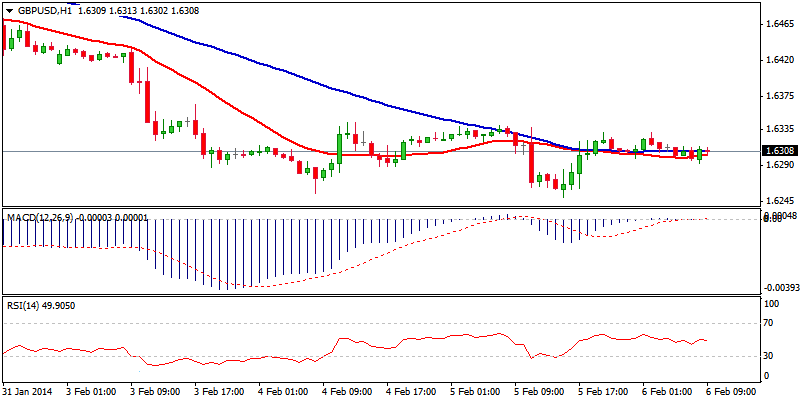 GBP/USD Hour Chart" title="GBP/USD Hour Chart" width="800" height="400">
USD/JPY
The pair remains in near-term corrective phase off 100.74, with corrective rally being capped by previous low at 101.75, also 4-hour 20SMA. Lack of strength to break above 101.75 hurdle, keeps near-term price action in sideways mode. Hourly studies are in neutral mode, while 4-hour technicals remain weak that sees upside attempts limited and downside risk remaining in play. Violation of initial 101 support is expected to open hourly double-bottom at 100.74, loss of which to resume broader bears off 105.43 and expose psychological 100 support, reinforced by 50% retracement of 96.55/105.43 rally and 200SMA. Only break above psychological 102 barrier and 102.50, Fibonacci 38.2% retracement, would delay bears.
Resistance: 101.75; 102.00; 102.50; 102.92
Support: 101.30; 101.00; 100.74; 100.42 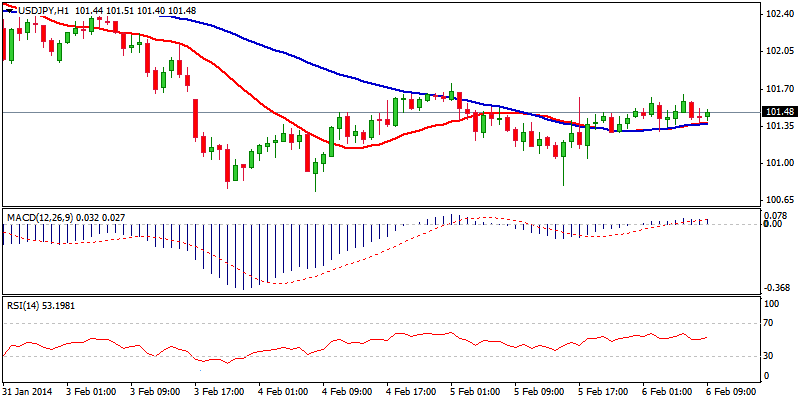 USD/JPY Hour Chart" title="USD/JPY Hour Chart" width="800" height="400">
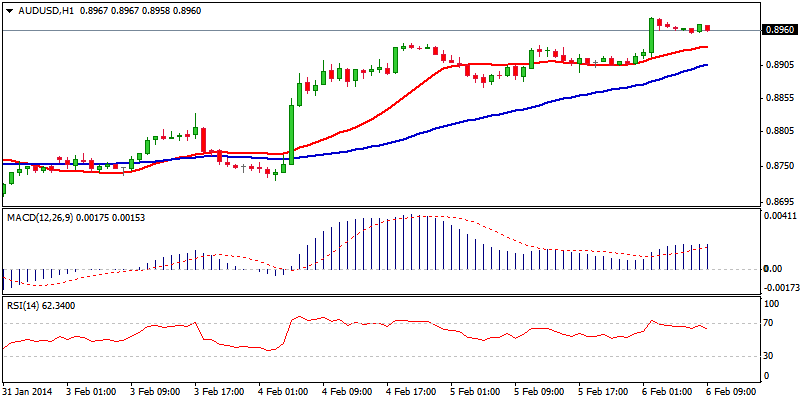
AUD/USD
The pair resumed bulls after ending near-term consolidative phase below 0.8940, with fresh extension higher, approaching next targets at 0.8983, Fibonacci 76.4% of 0.9084/0.8658 and 0.9000, 0.9000, psychological barrier / 03 Jan high. Positive near-term technicals keep the upside favored, with clearance of 0.9000 handle, expected to open way for full retracement of 0.9084/0.8658 descend. Regain of key 0.9084 resistance is required to confirm base and possibly spark stronger correction that would sideline overall bears, as daily studies show strong bullish momentum. Previous highs at 0.8940, offer initial support, ahead 0.8900, round figure / hourly 55SMA and 0.8870, higher low / daily Kijun-sen line, where dips should find solid support.
Resistance: 0.8983; 0.9000; 0.9056; 0.9084
Support: 0.8940; 0.8900; 0.8870; 0.8830
 AUD/USD Hour Chart" title="AUD/USD Hour Chart" width="800" height="400">
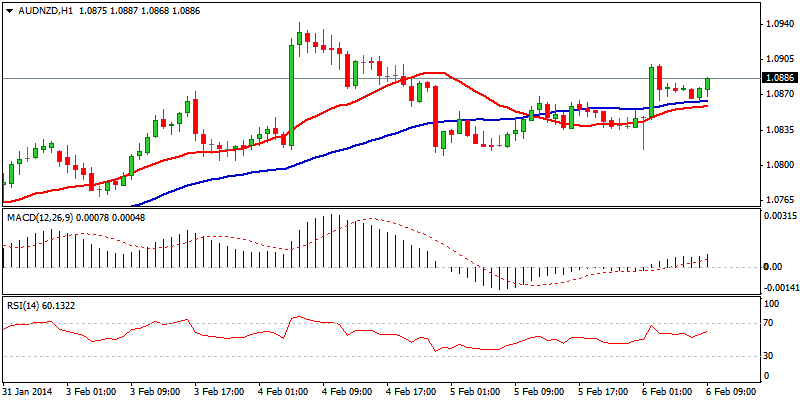
AUD/NZD
The pair consolidates recent rallies that peaked at 1.0942 and completed near-term bear-leg from 1.0911 to 1.0488. Pullback off 1.0942 was contained at 1.0810, where basing attempt is seen, as the price bounces higher. With hourly studies gaining traction, near-term focus shifts higher, as larger picture bulls remain intact. Break above 1.0942 to open next target at 1.1000, psychological barrier and Fibonacci 138.2% projection of the upleg from 1.0488. On the downside, 1.0810/00 zone, near-term base and Fibonacci 38.2% retracement of 1.0557/1.0942 upleg, offers good support and should keep the downside protected. Otherwise, violation of the latter is expected to delay bulls for deeper pullback towards Fibonacci supports of 50% and 61.8% retracement at 1.0750 and 1.0700.
Resistance: 1.0900; 1.0942; 1.1000; 1.1044
Support: 1.0810; 1.0750; 1.0723; 1.0700
 AUD/NZD Hour Chart" title="AUD/NZD Hour Chart" width="800" height="400">
XAU/USD
Spot Gold’s near-term price action is flat and moving within narrow range, following yesterday’s sharp rally that peaked at 1274 and quick reversal that fully erased gains. Stabilization above 1255, bull-trendline off 1240 low, keeps hopes of fresh attempts higher in play, as hourly indicators are just above their midlines, with 4-hour tone being positive. Also, break above near-term triangular consolidation, supports the notion. Regain of initial barriers at 1260 and 1266, is see as a trigger for renewed attack at yesterday’s peak at 1274 and final push towards key near-term resistance at 1278, 27 Jan peak. Alternative scenario sees violation of initial 1255 support, as first signal of weakness that requires slide below 1247 to be confirmed and open loser targets at 1237 and 1231 for retest.
Resistance: 1260; 1266; 1269; 1274
Support: 1255; 1247; 1240; 1237 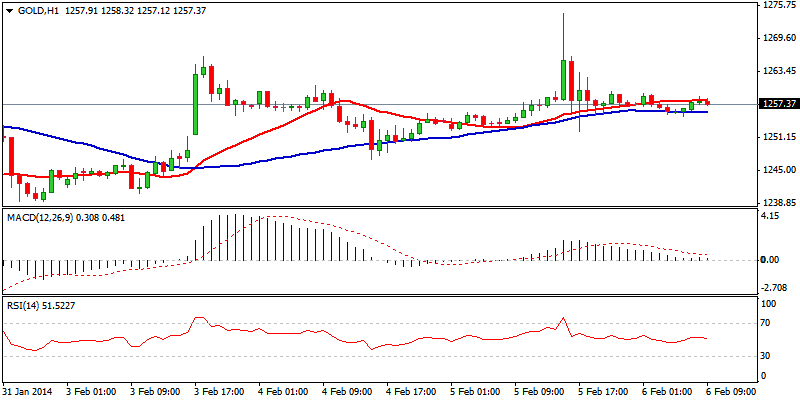 XAU/USD Hour Chart" title="XAU/USD Hour Chart" width="800" height="400">