
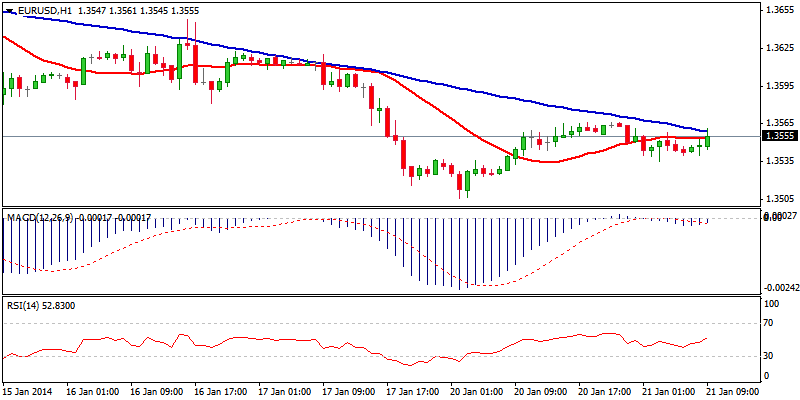
EUR/USD
The euro consolidates above fresh low at 1.3506, with the upside attempts being limited by hourly 55DMA /daily 100DMA / daily cloud base at 1.3566. Weak near-term studies do not see much of the upside prospect for now, as layers of strong resistances lay above, with the next ones at 1.3580, previous base and 38.2% retracement of 1.3698/1.3506 and 1.36 zone, 50% retracement / daily cloud top / 4-hour 55DMA, above which comes double-Fibonacci barrier at 1.3625 and lower top of 16 Jan at 1.3648. Only break here would neutralize near-term bears and turn near-term focus towards the upside. Otherwise, lower top, ideally around 1.36 handle, where broken bull-trendline off 1.2754 low reinforces barrier and fresh weakness, is seen as preferred near-term scenario. Break below 1.35 handle to resume weakness off 1.3892 top and expose 1.3435, Fibonacci 76.4% of 1.3294/1.3892 and psychological 1.3400 support.
Resistance: 1.3566; 1.3580; 1.3600; 1.3625
Support: 1.3506; 1.3460; 1.3430; 1.3400
 EUR/USD Hour Chart" title="EUR/USD Hour Chart" width="800" height="400">
EUR/JPY
The pair extends near-term recovery rally off fresh low at 140.30, turning hourly technicals positive and sidelining immediate downside risk. Strong barriers at 141.90 and 142.15, Fibonacci 61.8% of 142.89/140.30 descend / 17/Jan lower platform and bear-trendline off 145.67 peak, are under pressure, with break higher required to sideline near-term bears and allow for stronger recovery for possible attempt at key barrier and pivotal point at 143 zone, also mid-point of entire 145.67/140.30 descend. Alternatively, failure to clear 142.15 hurdle, would keep the downside at risk. Immediate support lies at 141.50/40, ahead of higher low at 140.90, loss of which to re-focus 140.30 and signal an end of corrective phase.
Resistance: 141.90; 142.15; 142.61; 142.89
Support: 141.40; 141.07; 140.90; 140.48 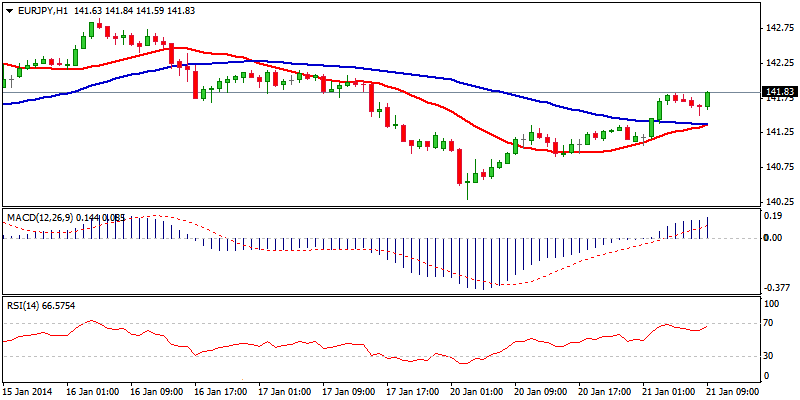 EUR/JPY Hour Chart" title="EUR/JPY Hour Chart" width="800" height="400">
GBP/USD
Cable trades in near-term consolidative mode, with price action entrenched within 1.6457/1.6393. The pair is so far unable to clearly break above bear-trendline off 1.6602 peak, currently at 1.6430 and last Friday’s peak at 1.6457 that keeps the downside risk in play. However, near-term technicals remain positively aligned, with hourly studies lacking momentum for now. Sustained break above 1.6457 is required to resume rally off 1.6393 and confirm bottom at 1.6393 that would open next significant barrier at 1.6515, 10 Jan lower top, for retest. Otherwise, downside risk would increase in case of violation of initial support and higher base at 1.64 zone.
Resistance: 1.6457; 1.6500; 1.6515; 1.6577
Support: 1.6422; 1.6409; 1.6393; 1.6364 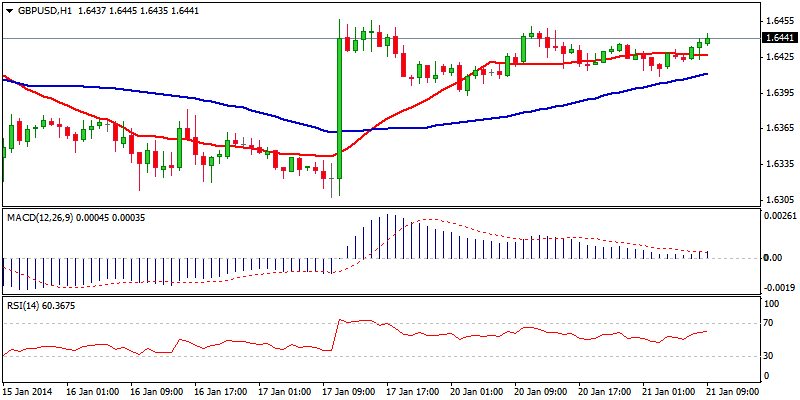 GBP/USD Hour Chart" title="GBP/USD Hour Chart" width="800" height="400">
USD/JPY
The pair regained strength after finding ground at 103.90 support zone, as fresh rally approaches initial barrier at 104.93. Break here is required to complete 104.93/103.85 corrective phase and confirm higher low formation for fresh attempt towards key hurdles at 105.40 zone. Positive near-term technicals support the notion, with overbought hourly studies seeing possible hesitation on approach. Downside should be ideally protected at 104.40, hourly 20DMA / hourly Kijun-sen line, to keep freshly established bulls off 103.85 intact. Otherwise, lower top formation and return to initial 103.90 support zone, with increased downside risk, would be likely scenario.
Resistance: 104.78; 104.93; 105.05; 105.34
Support: 104.56; 104.40; 104.13; 103.89 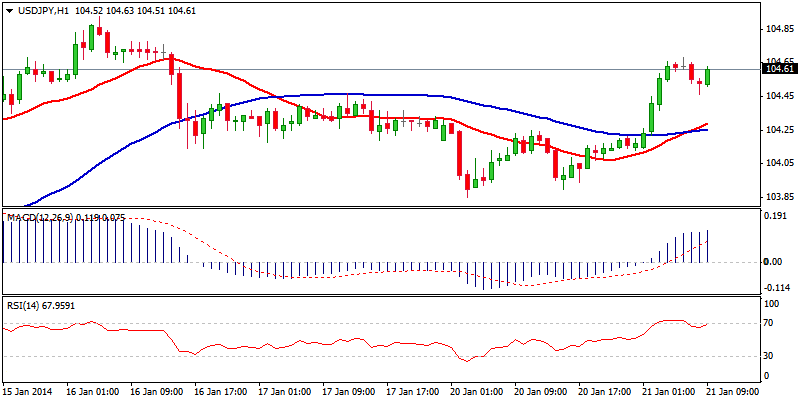 USD/JPY Hour Chart" title="USD/JPY Hour Chart" width="800" height="400">
AUDUSD
The pair remains in narrow range consolidative phase, after posting fresh low at 0.8755, with near-term tone being negatively aligned. Overall picture remains bearish and favors further downside, as acceleration through previous base at 0.8820 and psychological 0.8800 support signals resumption of larger downtrend towards next targets at 0.8576/43, Feb 2010 low / 50% retracement of multi-year 0.6007/1.1079 rally. Corrective rallies on oversold near-term studies remain capped at range top t 0.8830 zone, previous low / consolidation top / 4-hour 20DMA that keep the upside attempts limited. Only extension above 0.8881, Fibonacci 38.2% of 0.9084/0.8755 and psychological 0.8900 barrier would provide near-term relief.
Resistance: 0.8836; 0.8863; 0.8881; 0.8900
Support: 0.8775; 0.8755; 0.8733; 0.8700 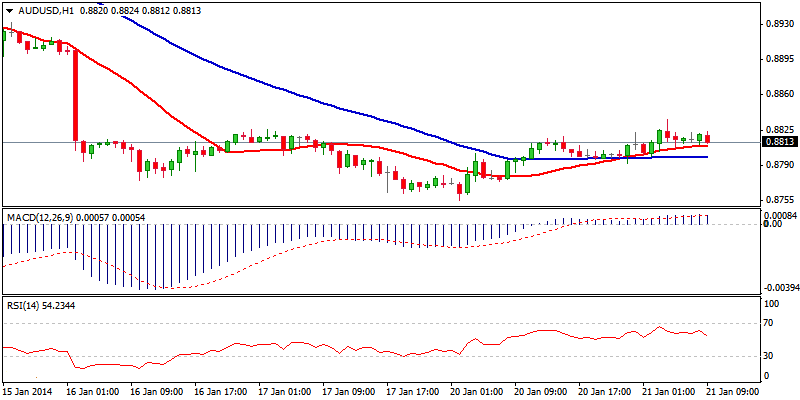 AUD/USD Hour Chart" title="AUD/USD Hour Chart" width="800" height="400">
AUD/NZD
The pair lost traction after corrective rally from fresh low at 1.0538 was capped at psychological / 50% retracement of 1.0858/1.0538 barrier at 1.0700. Subsequent acceleration lower that erased the biggest part of recovery rally, weakened near-term structure and shifted focus towards the downside. Slide below 1.0538 to signal completion of near-term corrective phase and resumption of larger downtrend, with immediate support laying at 1.0500, below which to look for completion of multi-year ascend from 1.0432 to 1.3790. Strong barrier at 1.0700 also marks a breakpoint and only break here would sideline immediate bears.
Resistance: 1.0600; 1.0660; 1.0700; 1.0733
Support: 1.0563; 1.0538; 1.0500; 1.0450 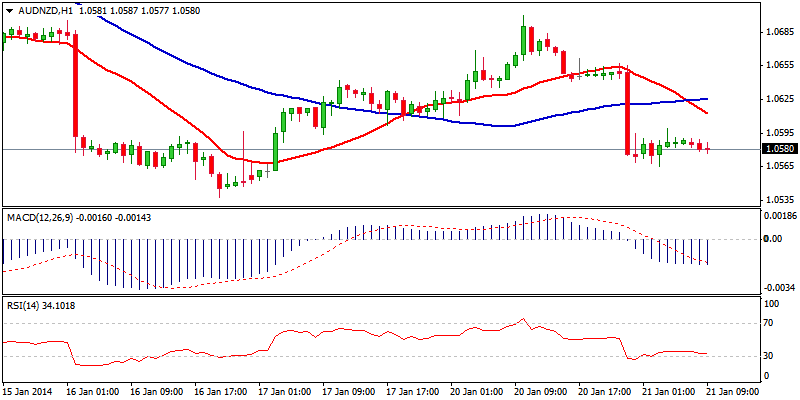 AUD/NZD Hour Chart" title="AUD/NZD Hour Chart" width="800" height="400">
XAU/USD
Spot Gold maintains overall positive tone, as extension of rally from 1234, where higher low was left, completed 1254/1234 corrective phase. Completion of cup and holder pattern requires break above 1261 peak to be confirmed and keep near-term focus at the upside, as the price cleared the last hurdle en-route towards key near-term barrier and pivotal point at 1267, 10 Dec high. Break here is required to confirm base at 1186/82 and spark stronger recovery, with initial target at 1278, Fibonacci 38.2% of 1433/1182 descend. Corrective action should be ideally contained at 1250 zone, 4-hour 20DMA and 38.2% retracement of 1234/1261 upleg, where the price is attempting to base. However, weakening hourly studies do not rule out further correction, with 1244 support required to hold extensions.
Resistance: 1254; 1258; 1261; 1267
Support: 1250; 1247; 1244; 1240 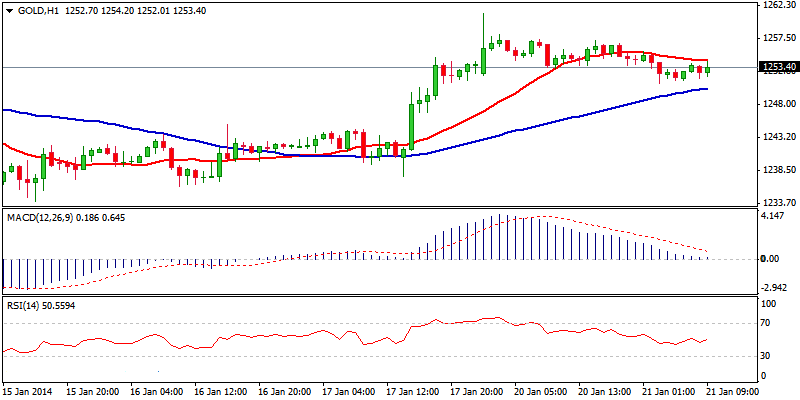 XAU/USD Hour Chart" title="XAU/USD Hour Chart" width="800" height="400">
- English (UK)
- English (India)
- English (Canada)
- English (Australia)
- English (South Africa)
- English (Philippines)
- English (Nigeria)
- Deutsch
- Español (España)
- Español (México)
- Français
- Italiano
- Nederlands
- Português (Portugal)
- Polski
- Português (Brasil)
- Русский
- Türkçe
- العربية
- Ελληνικά
- Svenska
- Suomi
- עברית
- 日本語
- 한국어
- 简体中文
- 繁體中文
- Bahasa Indonesia
- Bahasa Melayu
- ไทย
- Tiếng Việt
- हिंदी
Market Outlook: Cable Trades In Near-Term Consolidative Mode
Published 01/21/2014, 04:39 AM
Updated 02/21/2017, 08:25 AM
Market Outlook: Cable Trades In Near-Term Consolidative Mode
Latest comments
Loading next article…
Install Our App
Risk Disclosure: Trading in financial instruments and/or cryptocurrencies involves high risks including the risk of losing some, or all, of your investment amount, and may not be suitable for all investors. Prices of cryptocurrencies are extremely volatile and may be affected by external factors such as financial, regulatory or political events. Trading on margin increases the financial risks.
Before deciding to trade in financial instrument or cryptocurrencies you should be fully informed of the risks and costs associated with trading the financial markets, carefully consider your investment objectives, level of experience, and risk appetite, and seek professional advice where needed.
Fusion Media would like to remind you that the data contained in this website is not necessarily real-time nor accurate. The data and prices on the website are not necessarily provided by any market or exchange, but may be provided by market makers, and so prices may not be accurate and may differ from the actual price at any given market, meaning prices are indicative and not appropriate for trading purposes. Fusion Media and any provider of the data contained in this website will not accept liability for any loss or damage as a result of your trading, or your reliance on the information contained within this website.
It is prohibited to use, store, reproduce, display, modify, transmit or distribute the data contained in this website without the explicit prior written permission of Fusion Media and/or the data provider. All intellectual property rights are reserved by the providers and/or the exchange providing the data contained in this website.
Fusion Media may be compensated by the advertisers that appear on the website, based on your interaction with the advertisements or advertisers.
© 2007-2024 - Fusion Media Limited. All Rights Reserved.