
EUR/USD
The euro resumes rally from 1.3620, correction low, after leaving higher base at 1.3655, following two-day consolidation and retracing over 76.4% of 1.3809/1.3624 pullback. Near-term focus shifts towards double-top at 1.3809, above which to trigger final push towards key barrier at 1.3831, 25/10 year-to-date high. Indicators of lower timeframes moved into positive territory and support further advance, however, hesitation ahead of strong 1.3809 resistance cannot be ruled out, as hourly studies are overbought.
Previous consolidation top at 1.3715, also 38.2% retracement of 1.3624/1.3773 recovery rally, offers solid support and should ideally contain corrective dips. Negative scenario requires slide below 1.3700, psychological / 50% retracement support, to re-focus 1.3655 and 1.3624 supports.
Resistance: 1.3781; 1.3809; 1.3831; 1.3852
Support: 1.3734; 1.3715; 1.3700; 1.3679 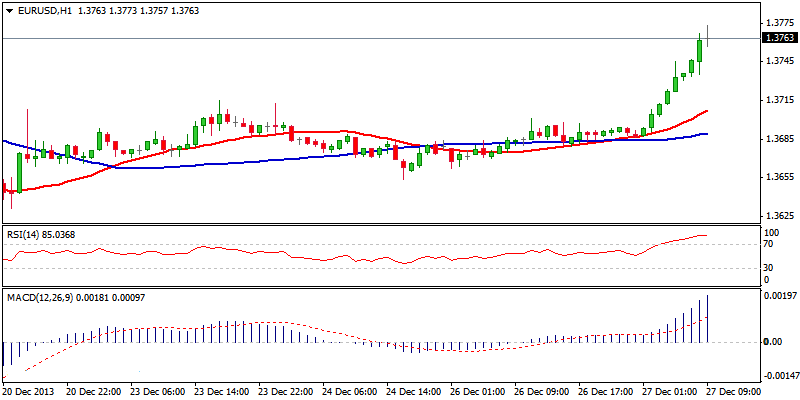 EUR/USD Hour Chart" title="EUR/USD Hour Chart" width="800" height="400">
EUR/JPY
The pair continues to trend higher and broke above psychological 144 barrier, after brief consolidation below previous peak at 143.52. Bulls focus at next hurdles at 149.25/44, 2007 low / Fibonacci 61.8% expansion of the upleg from 124.94, with interim barriers seen at round figure resistances. However, caution is required, studies on lower and larger timeframes are overbought and see scope for corrective pullback, before bulls resume.
Immediate support lies at 143.52, previous high and hourly 20DMA, while further easing below the next support at 143.25, yesterday’s consolidation floor and 50% retracement of 142.08/144.22 / hourly 55DMA, would look for test of strong level at 142.80, mid-December consolidation.
Resistance: 144.22; 144.50; 145.00; 145.50
Support: 143.82; 143.52; 143.25; 142.80 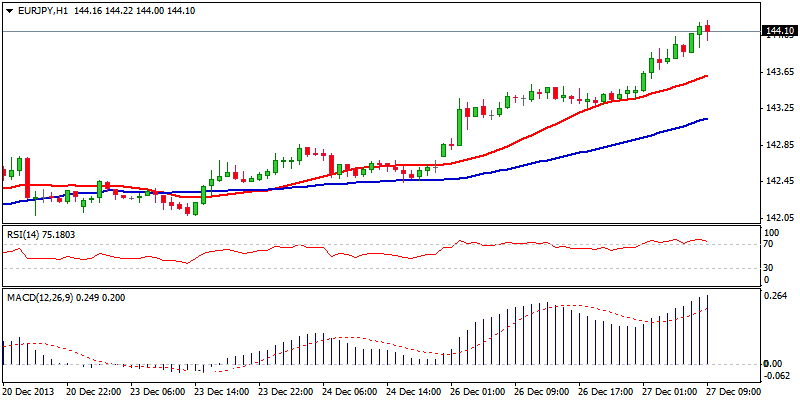 EUR/JPY Hour Chart" title="EUR/JPY Hour Chart" width="800" height="400">
GBP/USD
Cable is back to strength and resumes bulls after consolidation phase between 1.6315 and 1.6400. Renewed attempt and three-week range tops at 1.6480 zone, sees potential for resumption of larger uptrend, once barriers are cleared. Immediate target lies at psychological 1.6500 barrier, with extension higher to open 1.6617, Aug 2011 peak and 1.6637/45, May/Apr 2011 peaks.
Near-term technicals are positive, however, overbought conditions on one and four-hour timeframes, warn of hesitation at key obstacles. Initial support lies at 1.64 zone, overnight low, ahead of 1.6370, formed consolidation tops. Any extension below 1.6315, consolidation floor, will be bearish.
Resistance: 1.6484; 1.6500; 1.6520; 1.6550
Support: 1.6400; 1.6370; 1.6315; 1.6300 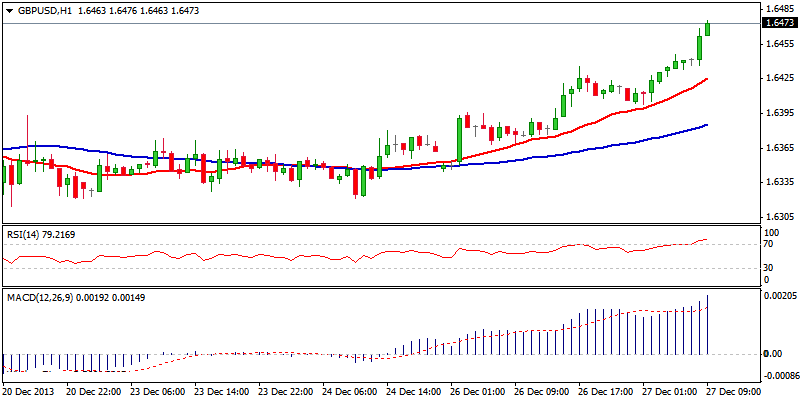 GBP/USD Hour Chart" title="GBP/USD Hour Chart" width="800" height="400">
USD/JPY
The pair resumes larger uptrend that shows the eight consecutive positive weekly close on a rally from 96.93, 20/10 higher low. Psychological 105 barrier is cracked that opens way towards next target at 105.58, Fibonacci 61.8% retracement of multi-year 124.14/75.55 descend. Overall bulls are firmly in play, with corrective easing on momentum losing hourly studies, facing initial support at 104.55, Fibonacci 38.2% retracement of 103.76/105.02 upleg / hourly 55DMA, ahead of higher platform / Fibonacci 61.8% retracement at 104.20.
Any extension below important 104.00/103.80 support zone 13/12 high / 23/12 low, reinforced by 4-hour 55DMA, would signal that bulls are losing traction.
Resistance: 104.84; 105.02; 105.58; 106.00
Support: 104.55; 104.20; 104.00; 103.80 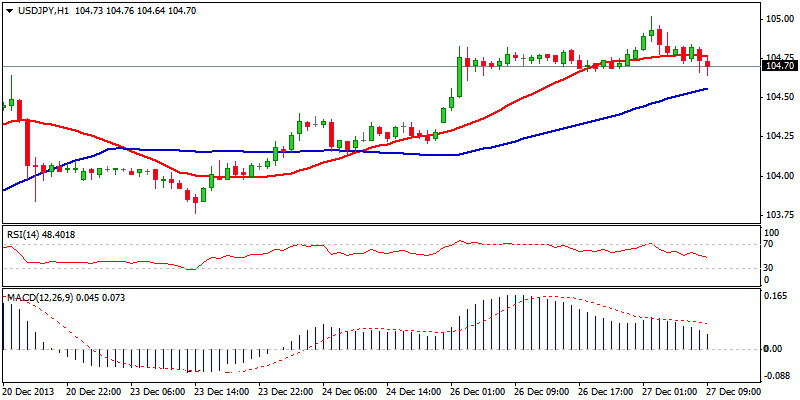 USD/JPY Hour Chart" title="USD/JPY Hour Chart" width="800" height="400">
AUD/USD
Near-term structure remains weak, as the pair failed to regain psychological 0.9000 barrier, on recovery attempt from 0.8819, 18/12 low. The price action is entrenched within 0.8875 and 0.8957 range, with negative bias seeing the downside at risk, as long as the price stays capped under 0.9000 zone, also 50% retracement of 0.9165/0.8819 descend, reinforced by falling daily 20DMA.
Any extension above initial 0.9000 hurdle, would ease immediate pressure and allow for further recovery, however, key short-term barrier and lower platform at 0.9165, is expected to cap. On the downside, violation of 0.8819/00 supports, to signal resumption of larger downtrend and open 0.8769, Aug 2010 low.
Resistance: 0.8931; 0.8957; 0.9000; 0.9033
Support: 0.8900; 0.8875; 0.8854; 0.8819 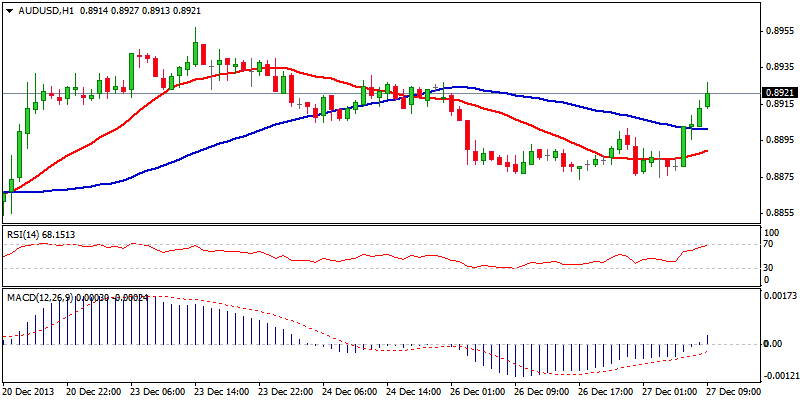 AUD/USD Hour Chart" title="AUD/USD Hour Chart" width="800" height="400">
AUD/NZD
The pair remains in near-term consolidative sideways mode, with price being entrenched within very narrow range in past few days. Hourly studies are neutral, while positive tone exists on 4-hour chart, favoring resumption of near-term recovery action off 1.0733, 18/12 low.
Break above range top at 1.0911 and Fibonacci 61.8% retracement of 1.1044/1.0733 downleg at 1.0925, is required to confirm positive scenario and open psychological 1.1000 barrier and more significant lower tops at 1.1044/66, above which to confirm near-term base. The price action is for now supported by 20/55DMA’s bullish crossover at 1.0850, also range floor and break here would weaken near-term structure for psychological 1.0800 support, also Fibonacci 61.8% retracement of 1.0733/1.0911 recovery rally.
Resistance: 1.0911; 1.0925; 1.0946; 1.1000
Support: 1.0871; 1.0850; 1.0822; 1.0800 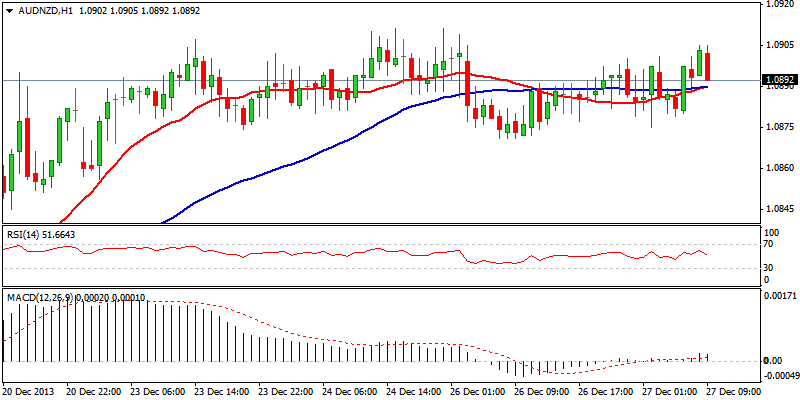 AUD/NZD Hour Chart" title="AUD/NZD Hour Chart" width="800" height="400">
XAU/USD
Spot Gold’s near-term structure is turning positive, as the price bounced from fresh low at 1186 and stabilizes above psychological 1200 handle. However, gains were so far capped at 1217, Fibonacci 38.2% retracement of 1267/1186 downleg, reinforced by falling 4-hour 55DMA and near bear-trendline / daily 20DMA at 1224.
Break here is required to signal resumption of near-term bulls towards 1236, Fibonacci 61.8% retracement and lower tops at 1244/51. Corrective action is expected to hold above 1200 support, to keep the structure intact. Failure to break higher, however, would increase downside risk, as loss of 1200 support would bring bears back in play for retest of 1186 and extension towards key short-term support and target at 1180.
Resistance: 1217; 1224; 1236; 1244
Support: 1208; 1200; 1192; 1186 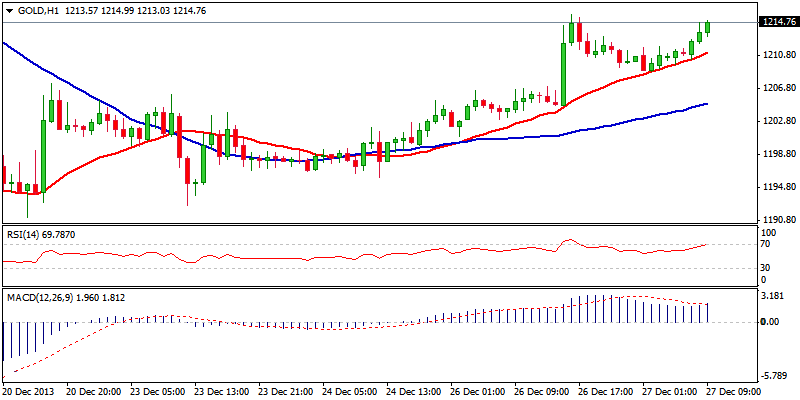 XAU/USD Hour Chart" title="XAU/USD Hour Chart" width="800" height="400">