
EUR/USD
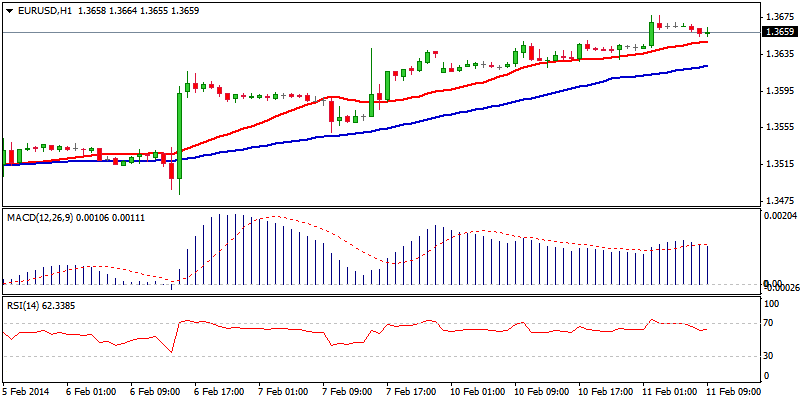
The euro’s corrective phase off 1.3480 base rides on the third wave that commenced from 1.3550 and reached nearly 100% Fibonacci expansion, on fresh extension to 1.3677. The wave could travel to 1.3738, 24 Jan peak, also its 138.2% expansion, once the price clears initial 1.3685 resistance, lover platform of 28/29 Jan / Fibonacci 100% expansion. Positive near-term technicals support the notion, however, overbought conditions on lower timeframes, see corrective action before fresh push higher. Initial supports at 1.3620, yesterday’s higher platform and 1.3600, Fibonacci 38.2% of 1.3482/1.3677 rally, should ideally keep the downside protected, as 20/55 SMA’s bullish cross at 1.3575 underpins.
Resistance: 1.3680; 1.3700; 1.3738; 1.3800
Support: 1.3620; 1.3600; 1.3580; 1.3550
 EUR/USD Hour Chart" title="EUR/USD Hour Chart" width="800" height="400">
EUR/JPY
The pair remains steady and aims at psychological 140.00, as near-term consolidative phase was contained at 139.15 and fresh strength cracked main bear trendline, drawn off 145.67 and daily Kijun-sen line at 139.70. Near-term technicals are positive, but overextended 4-hour conditions suggest further hesitation ahead of 140 barrier. The price action should hold above near-term base at 139.15, to keep bulls intact for attempt towards initial targets at 140.30/50 and psychological 141.00 and lower top at 141.23 in extension. Conversely, loss of 139.15/00 handles would delay bulls for deeper pullback towards 138.50, Fibonacci 38.2% retracement of 136.21/139.92 rally and higher base / psychological support at 138.15/00.
Resistance: 139.92; 140.00; 140.40; 140.85
Support: 139.15; 138.85; 138.50; 138.15 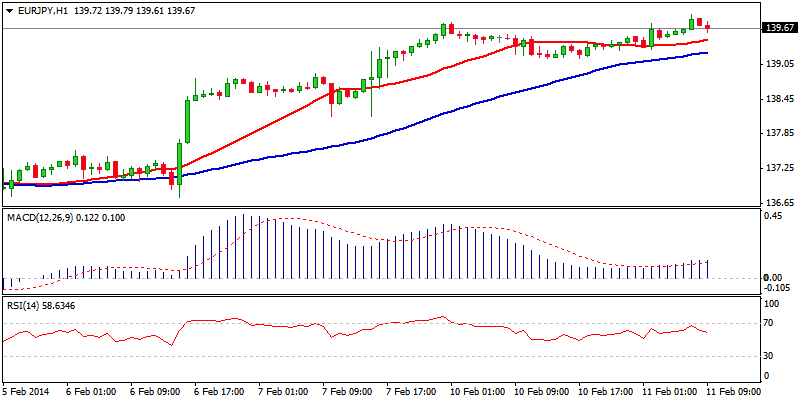 EUR/JPY Hour Chart" title="EUR/JPY Hour Chart" width="800" height="400">
GBP/USD
The Cable’s near-term structure remains positive but the price lack momentum for sustained break above 1.64 handle, as near-term price action stays congested within 1.6380/1.6433 range. The upside is for now capped by daily Ichimoku cloud top / Tenkan-sen line and 20SMA, while hourly 55SMA protects the downside. Lift above initial 1.6433 hurdle is required to confirm resumption of bull-leg from 1.6250 base and open 1.6459, 50% of 1.6623/1.6250, with psychological 1.6500 hurdle, also Fibonacci 61.8%, seen in extension. Slide under 1.6380 base, would delay, while extension below 1.6350, previous consolidation top, would neutralize near-term bulls.
Resistance: 1.6433; 1.6459; 1.6500; 1.6524
Support: 1.6380; 1.6363; 1.6350; 1.6320 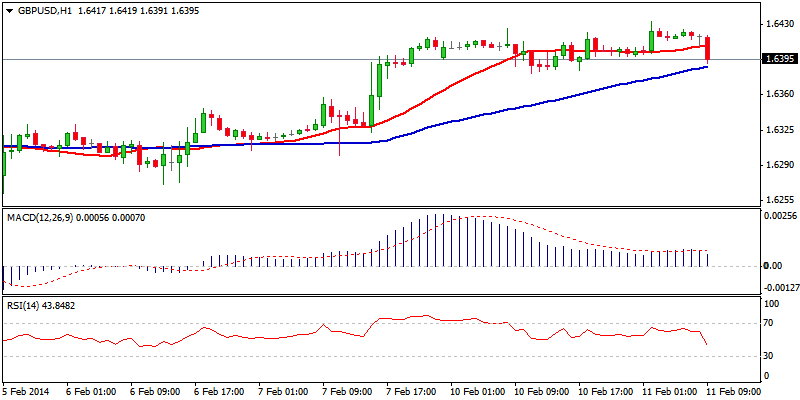 GBP/USD Hour Chart" title="GBP/USD Hour Chart" width="800" height="400">
USD/JPY
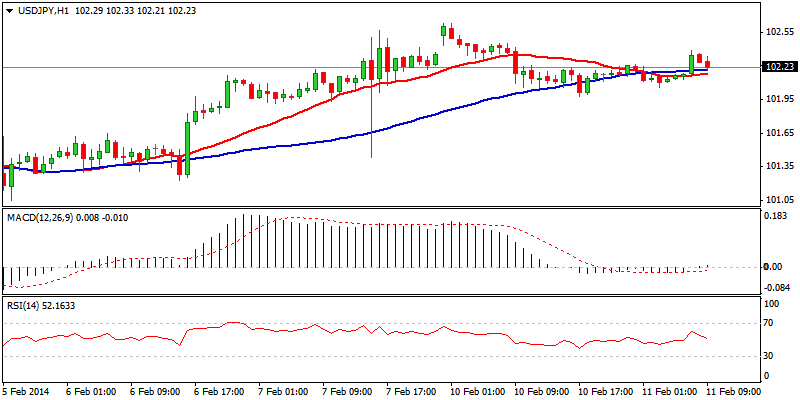
The pair remains steady as extension of corrective phase off 100.74, peaked at 102.63, above 38.2% retracement of 105.43/100.74 descend, with subsequent consolidation under way. Corrective dips were so far contained at psychological 102.00 support, reinforced by hourly 20SMA, with near-term price action moving within 102.00/40 range. Hourly studies are neutral, while positive tone prevails on 4-hour chart and keeps near-term focus at the upside. Fresh strength through 102.63 to open 102.92/103.09, 31 Jan lower top / Fibonacci 50% of 105.43/100.74, with regain of key 103.43 lower top of 29 Jan, required to complete 103.43/100.74 descend and confirm bottom at 100.74, for stronger recovery. Otherwise, loss of 102.00 handle and next significant support at 101.75, would soften near-term tone and risk further easing.
Resistance: 102.39; 102.63; 102.92; 103.09
Support: 102.00; 101.75; 101.50; 101.00
 USD/JPY Hour Chart" title="USD/JPY Hour Chart" width="800" height="400">
AUD/USD
The pair resumes rally from 0.8658 low, as completion of near-term consolidative phase resulted in break above psychological 0.9000 barrier. This open way for extension towards key near-term barrier at 0.9084, 13 Jan peak / near Fibonacci 38.2% retracement of 0.9755/0.8658, to complete 0.9084/0.8658 bear-phase and confirm near-term base for further retracement of multi-month descend from 0.9755 to 0.8658. Positive near-term studies remain supportive for such scenario, however, corrective action on overbought conditions is likely to precede final push to 0.9084 target. Initial support lies at 0.8900 higher platform, ahead of 0.8870, which should not be exceeded in case of stronger pullback.
Resistance: 0.9056; 0.9084; 0.9100; 0.9165
Support: 0.9000; 0.8940; 0.8900; 0.8870 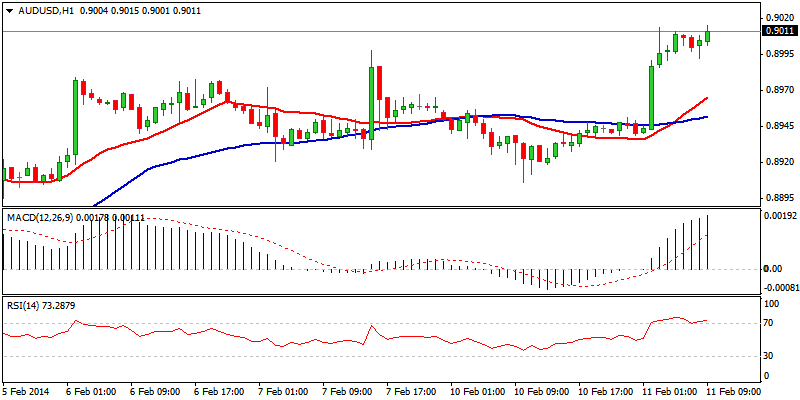 AUD/USD Hour Chart" title="AUD/USD Hour Chart" width="800" height="400">
AUD/NZD
Near-term structure improves as the price bounced off yesterday’s low at 1.0778 and broke above initial 1.0810 barrier, to crack bear-trendline off 1.0942 at 1.0850. Hourly studies are positive, while 4-hour indicators are attempting above the midlines. Sustained break above trendline resistance and regain of important 1.0880/1.0900 barriers is required to confirm reversal and re-focus key near-term barrier at 1.0942, 04 Feb recovery peak. Alternatively, risk of lower top formation and fresh weakness would remain in case the price stalls under 1.0880, with extension below 1.0800 handle required to confirm negative scenario.
Resistance: 1.0860; 1.0882; 1.0900; 1.0942
Supprot: 1.0832; 1.0810; 1.0778; 1.0756 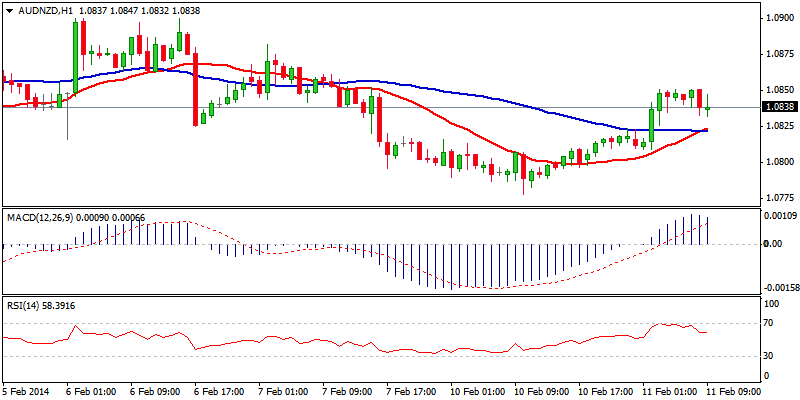 AUD/NZD Hour Chart" title="AUD/NZD Hour Chart" width="800" height="400">
XAU/USD
Spot Gold’s near-term structure remains bullish, as the price rallied above key near-term resistance at 1278, completing 1278/1237 corrective phase. Resumption of larger rally from 1182, heads towards the next target at 1294, 14 Nov high, with psychological 1300 expected to come in focus on a break. Near-term technicals maintain positive tone, however, overbought studies see corrective pullback preceding fresh strength. Previous peaks at 1278/74, offer immediate supports, ahead of 1267, Fibonacci 38.2% retracement of 1237/1287 rally, seen as ideal reversal point.
Resistance: 1287; 1294; 1300; 1307
Support: 1278; 1274; 1267; 1261 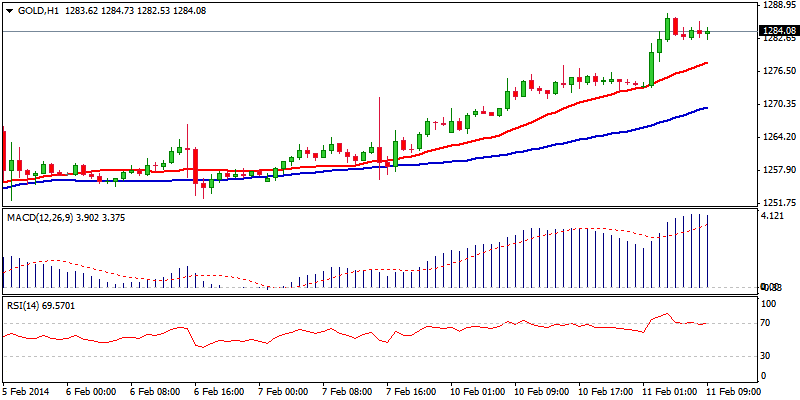 XAU/USD Hour Chart" title="XAU/USD Hour Chart" width="800" height="400">