This Bespoke detail on sentiment is a week old – nothing about broad investor sentiment was contained in this week’s Bespoke Report – typically published every week on Friday night:
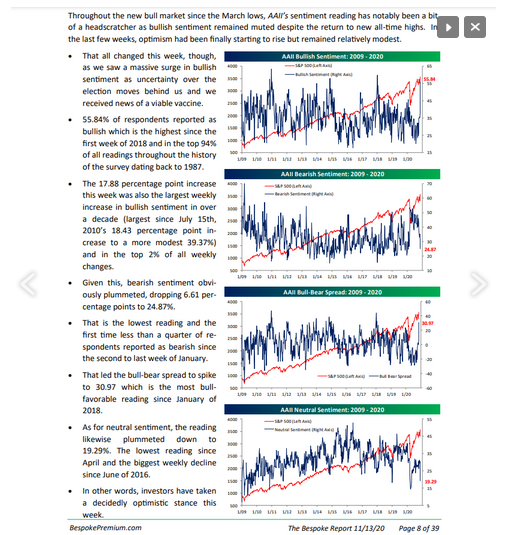
A little worrisome.
Breadth:
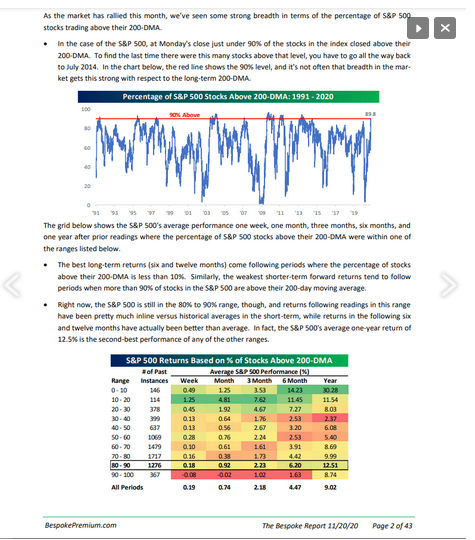
From Friday night, 11/20/20 Bespoke Report.
Speaking of market breadth, one of the big differences between today’s FAAMG led the market, where the top 5 – 6 stocks are accounting for a healthy percentage of the S&P 500’s total return, and the infamous late 1990s is that – in the late 1990’s – breadth started to fail well before the March 2000 top.
The Fed and Treasury spat:
Cam Hui (@humblestudent) wrote an interesting article which talks about credit spreads and watching high-yield or below-investment-grade credit spreads given the current divergence between the Fed and Treasury. I tweeted on this Thursday and/or Friday of this past week, noting that some of the Fed’s liquidity programs designed to support high-yield credit were never really used to their full extent and credit spreads recovered on their own starting in April – May ’20. That’s a good thing.
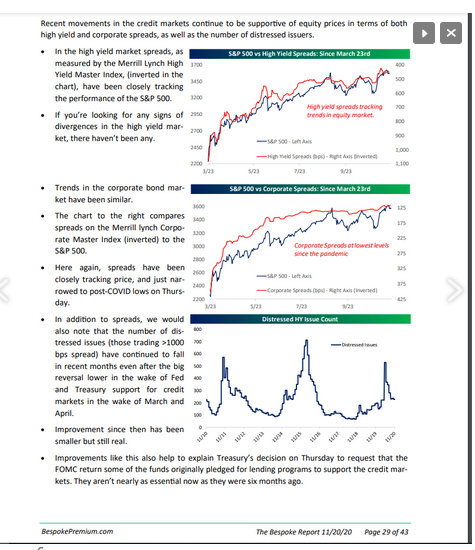
From the 11/20/20 Bespoke Report.
High-yield and corporate credit spreads are not yet an issue.
Emerging Markets and Russell 2000 Action:
This is a great post from Jeff Miller, which contained therein is a History of Asset Class Returns which provides a logical rationale for owning Emerging Markets (NYSE:EEM) and the Russell 2000, at least for the next 12 – 13 months.
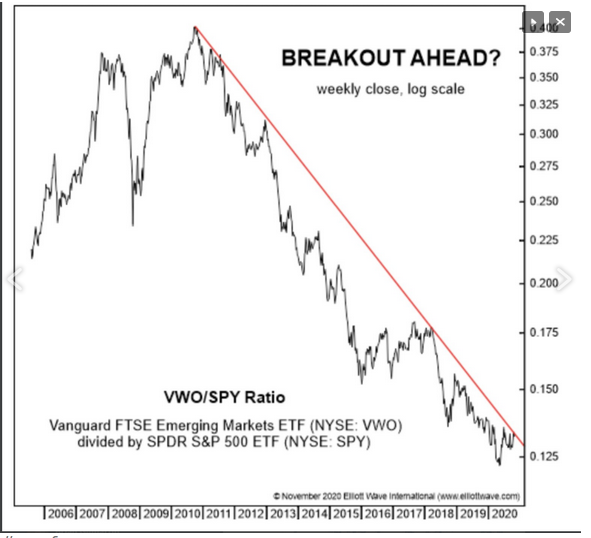
The Vanguard FTSE Emerging Markets Index Fund ETF Shares (NYSE:VWO) has traded above the longer-term downtrend line off the 2007 high near $55 this week. The VWO rose 1.63% this week, and over 6% the last month, versus the SP 500’s -0.77% decline this past week, and is demonstrating good relative strength versus the SP 500 again.
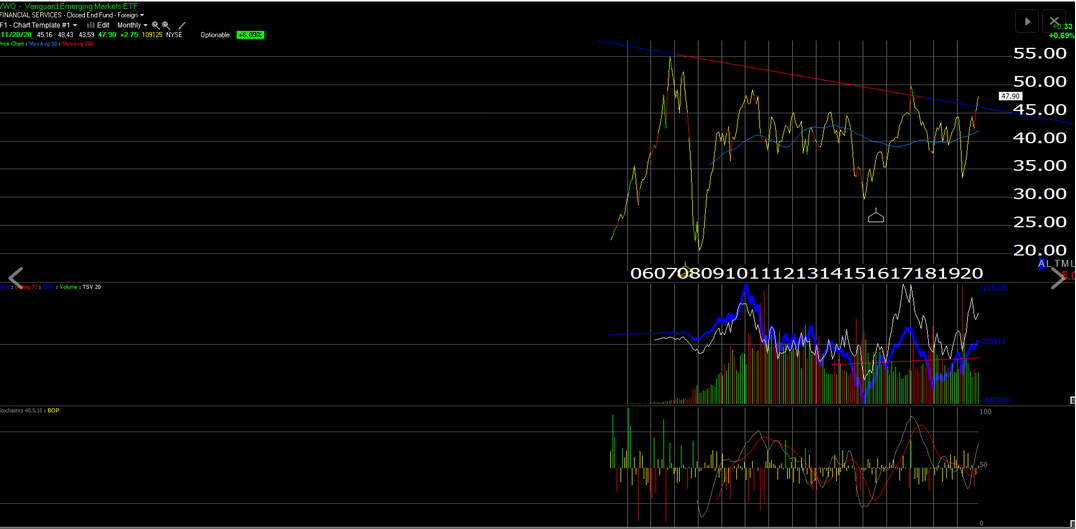
Here might be an even more telling chart for the VWO that was circulating around Twitter the past week:
In the history of asset class returns that shows up in the Jeff Miller article, in the 10 years including 2010 – 2019, Emerging Market stocks and International Developed stocks have been the worst or 2nd to the worst-performing asset class in 6 of those 10 years.
2017 was a good year for EM stocks, the only year EM stocks were the top-performing asset class other than 2012.
On Nov. 8, I detailed how the “average, annual” return for S&P 500 versus the Emerging Markets is also a compelling fundamental reason to own EM’s.
Oakmark International (OAKIX), which is our International Developed holding for client portfolios, was down 22% YTD on October 30th, but has now recovered to down just a little over 3% on November 20th, 2020. David Herro the portfolio manager of Oakmark International is a top-notch investor, and client’s funds have been slowly added to the mutual fund over 2020. While David’s fund remains in the 93rd percentile of all international funds YTD, it has risen to the 1% percentile rank the last quarter.
EM and Int’l Developed are due for a breakout year, where both substantially outperform the S&P 500. Maybe it’s 2021, maybe not.
Summary / Conclusion:
Since the S&P 500’s generational low in March 2009, one of the hallmarks of this market is how quickly sentiment turns bearish on even – what would normally be considered minor pullbacks – i.e. 2% – 3% declines. There is no question that perhaps due to the vaccines and/or the election, bullish sentiment has risen sharply in November, but as the top two graphs show, so has market breadth is still a positive, which is nice to see with the typical negative that is bullish sentiment.
The RSP, (equal-weight S&P 500), the VWO (Vanguard EM ETF), the IWM (Russell 2000 ETF) and the Oakmark International (OAKIX), continue to be added to client accounts as some form of migration away from the market-cap and large-cap growth heavy S&P 500 is anticipated.
Watch that VWO chart versus the S&P 500. That’s a pretty long downtrend about to be broken, and soon potentially.
Take all of the above with healthy skepticism and do your own homework. Invest in a way that you are comfortable and don’t worry about what the rest of the world is doing.
