
The S&P 500 Index broke out to new all-time highs recently (see chart below). This is a bullish market event.
That being said, the advance occurred in combination with poor market breadth. Meaning that there are a large number of stocks within the index that are not advancing to new highs. That may sound counter-intuitive, but it occurs because the index is capitalization-weighted and larger-cap stocks have a greater weighting in the performance of the index.

Another index breaking out to new highs is the Nasdaq 100.

While it is bullish that those two indexes have advanced, it is doing so on poor market breadth.
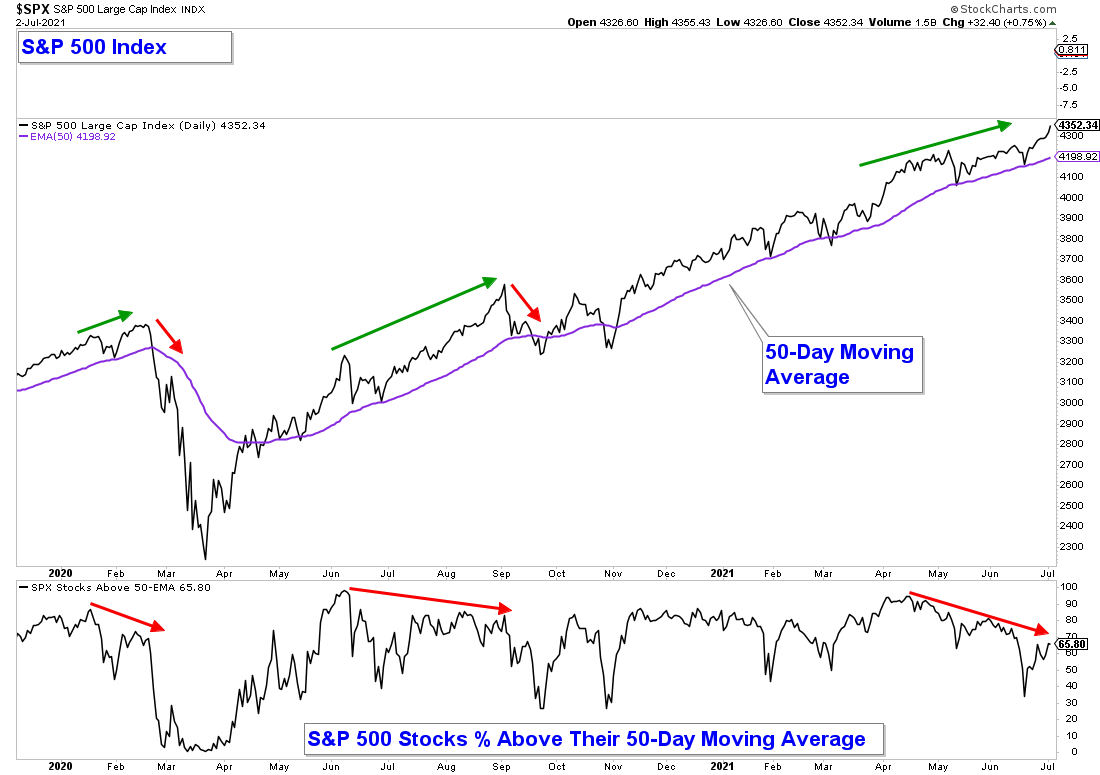
Below is a chart of the S&P 500 index charted with its 50-day moving average in the upper panel. In the lower panel is a chart that indicates the percentage of stocks within that index that are above their respective 50-day moving averages.
Notice how the S&P 500 is substantially above its moving average. However, as of Friday’s market close, only 65% of the stocks within the index were above their moving averages. And that number has been on the decline since early April.
I will be watching to see if we can get an expansion in the number of stocks participating in any further market advance. If we do, that would be very bullish. If not, it would be a red flag to monitor and could forewarn of continued market choppiness and/or an increase in the odds of a market pullback or correction.
Another way to analyze market breadth is to simply look at different sectors, industry groups and indexes to see if they are duplicating the strength seen in the S&P 500.
Below is a chart of the NYSE Composite Index and it is still consolidating near its recent highs. It would be a bullish sign if this index can break to new highs soon.

Small-Cap stocks have been consolidating since February and they also have not broken out to new highs.

Semiconductor stocks are a risk-on asset that tends to lead the market. The iShares Semiconductor ETF (NASDAQ:SOXX) has marginally broken above consolidation. If this index can hold above what is now support (April’s peak), it would be a bullish broad market signal. On the other hand, a drop below would signal caution.

The Bottom Line
The breakout of both the S&P 500 and Nasdaq 100 are bullish developments. Despite the weakness in market breadth, the trend is up.
If we see an improvement in market breadth in the coming weeks combined with breakouts in other indexes, sectors and industry groups, that would be very bullish.
On the other hand, the more market breadth deteriorates, the greater the risk of a pullback or correction in equities.