
Positioning, not fundamentals, moves the market
Friday’s market action was purely technical. If anything the news was USD-positive, after US Q3 GDP was revised up yet again to +4.1% qoq saar on stronger results for consumption and business investment. In other words, US Q3 GDP was double the consensus forecast of +2.0% before the initial estimate was released on 7 Nov, which supports the Fed’s decision to begin tapering off its bond purchases. Yet US long-term bond yields peaked shortly after the release and the dollar declined with them during the day even though the implied yield on Fed Funds futures continued to rise, with the far 2016 contracts gaining another 8 bps or so. Stocks seem to be doing much better than the dollar.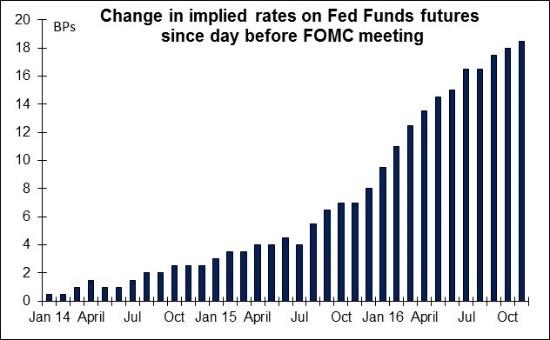
The main action Friday was in USD/CAD, which initially rose to a high for the year on below-forecast inflation figures for November. However there was apparently considerable end-year demand for CAD and the pair managed to close lower on the day. The range for the day was 1.0628-.0738 or 1.04%, which is extraordinary considering the range for the entire year has been 9.39%. AUD was the biggest gainer on the day. Market participants were apparently impressed on Friday that AUD/USD failed to make a new low despite the ninth consecutive daily fall in Chinese stocks as liquidity fears continue to weigh on the market. With the Chinese market recovering somewhat Monday, AUD/USD recovered further with it. The move seems to be mostly due to the closing of short AUD/USD positions ahead of the holidays rather than any big change in view about Australia.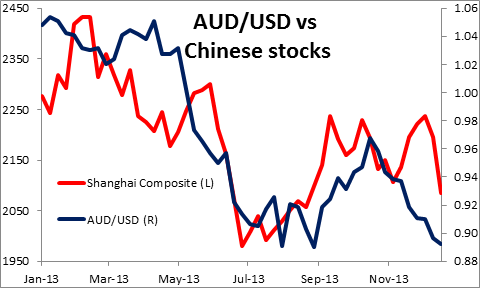 AUD/USD vs. Chinese Stocks" title="AUD/USD vs. Chinese Stocks" width="480" height="288">
With the Christmas holidays this week, I expect activity to be quite thin and movements to be much more technical than fundamental. End-year window-dressing needs will dominate the market rather than any view on the prospects for a currency as investors are likely to do only the trades that they have to. In this thin market, prices can be either quite volatile or deadly dull: in 2007 the week of Christmas was tied for the second highest volatility week of the year and in 2008 it was the most volatile week of the year, while in 2011 it was in the bottom 20% and in 2012 it was the fifth quietest week of the year.
For today, there is a holiday in Japan and no major European indicators, just German import prices (expected to continue falling) and Italian consumer confidence (expected to rise a bit). The main indicator will be the US personal income & spending figures for November. They’re both expected to show solid rises of 0.5% mom. Meanwhile the personal consumption deflator, the Fed’s preferred inflation gauge, is expected to rise 0.9% yoy, a faster pace than 0.7% yoy in October – still well below the Fed’s 2% target but going in the right direction. The U of Michigan consumer confidence figure for December is also expected to be revised up slightly to 83.0 from 82.5. This kind of strong data is likely to support the dollar. In Canada, October GDP is forecast to slow to +0.2% mom from +0.3%, which could send CAD lower again – although given the sharp rebound on Friday, I wouldn’t bet on such a move lasting very long. Otherwise there’s little on the schedule, no speakers. I expect a day of quiet pre-holiday trading.
For the rest of the week there are a number of US indicators coming out, such as Richmond Fed and Chicago Fed indices, new home sales and durable goods orders that may add to the view of a strong US economy. Japan also sees the usual end-of-month data dump. Eurozone indicators however are very light while in the UK there is only mortgage applications. Thus today will probably be effectively the last day of serious trading for the year.
The Market
EUR/USD 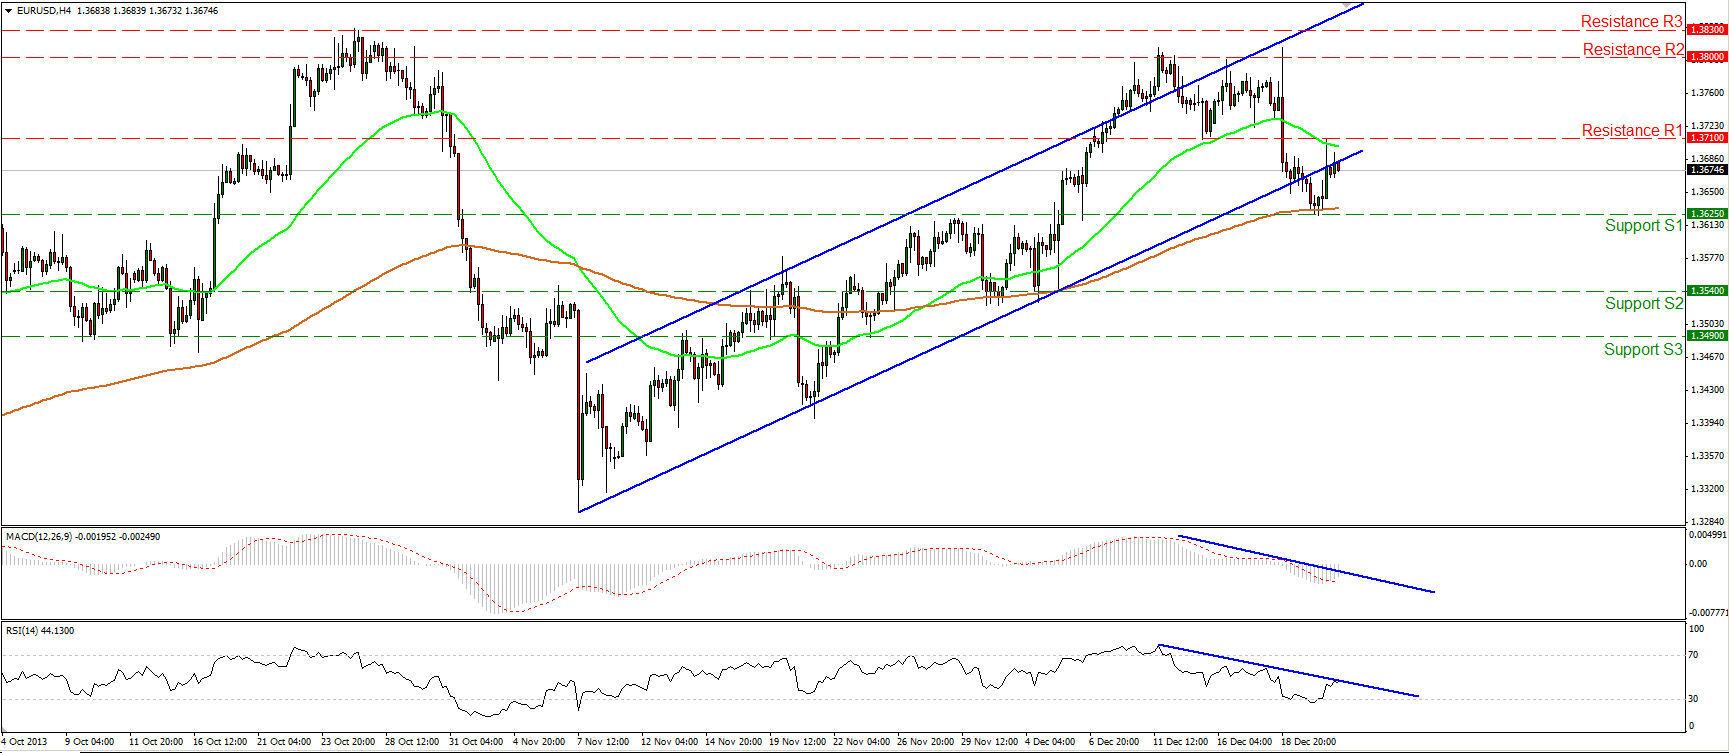 EUR/USD Hourly Chart" title="EUR/USD Hourly Chart" width="480" height="288">
The EUR/USD moved higher on Friday but the advance was halted by the lower boundary of the upward sloping channel, which is now providing resistance. If the bears manage to take control and push the price lower, breaking the 1.3625 (S1) barrier, I expect them to trigger extensions towards the next support at 1.3540 (S2). Both momentum studies follow downward paths, confirming the negative momentum of the pair.
• Support: 1.3625 (S1), 1.3540 (S2), 1.3490 (S3).
• Resistance: 1.3710 (R1), 1.3800 (R2), 1.3830 (R3).
USD/JPY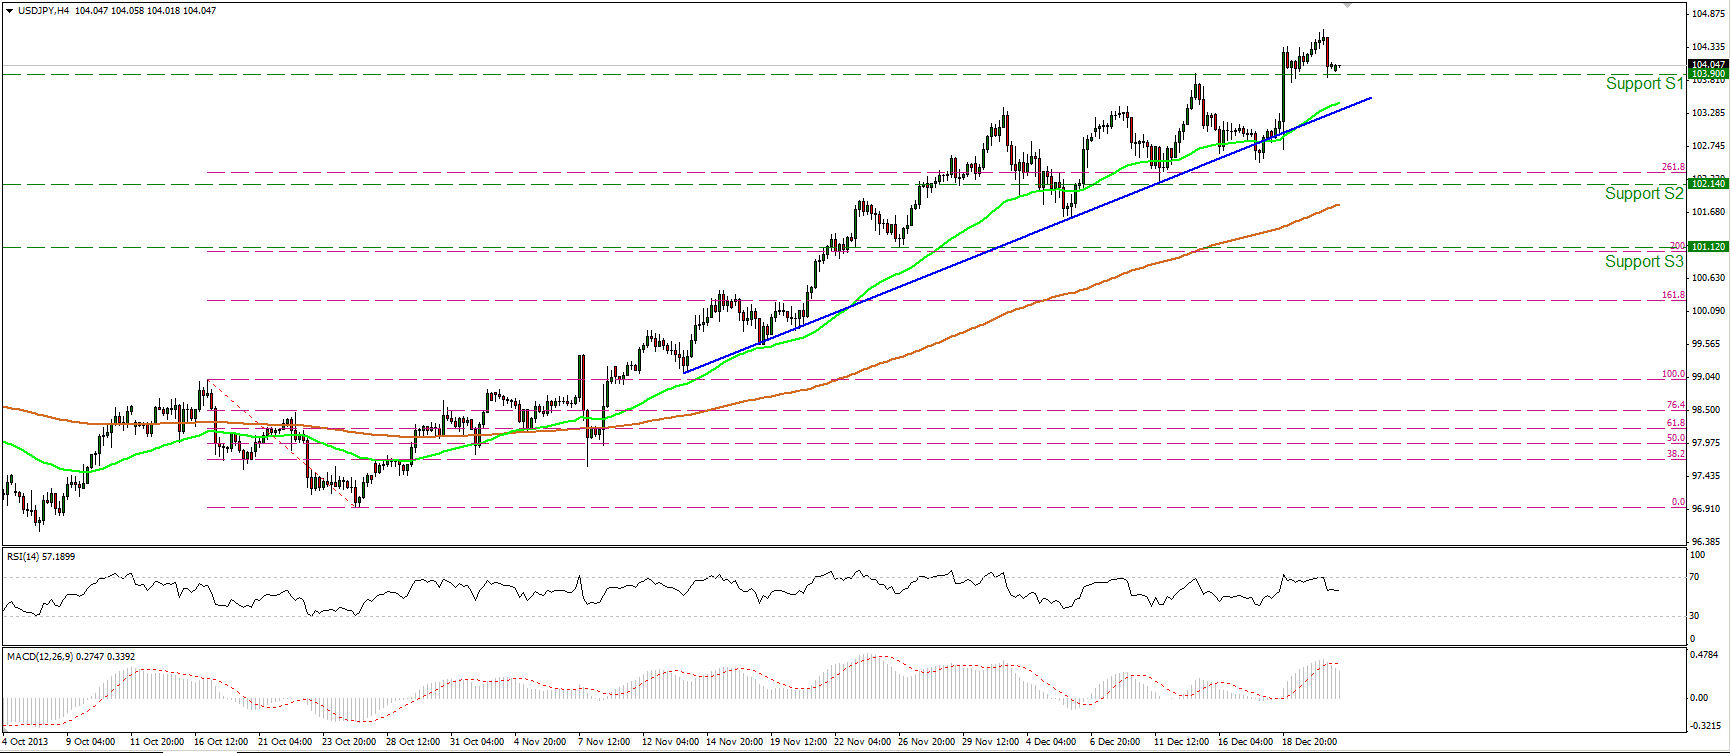 USD/JPY Hourly Chart" title="USD/JPY Hourly Chart" width="480" height="288">
The USD/JPY moved lower but the longs managed to maintain the rate above the 103.90 (S1) support. At the time of writing the currency pair is trading slightly above that barrier and I would expect it to continue its advance, targeting the 105.45 (R1) hurdle, which coincides with the 423.6% Fibonacci extension level of the bearish wave prior to the uptrend. The short-term trend remains in effect, since the price is well supported by the blue support line and the 50-period moving average. On the daily and weekly charts, the subsequent move upon the escape of the symmetrical triangle remains in effect.
• Support: 103.90 (S1), 102.14 (S2), 101.12 (S3).
• Resistance: 105.45 (R1), 108.25 (R2), 110.60 (R3).
EUR/GBP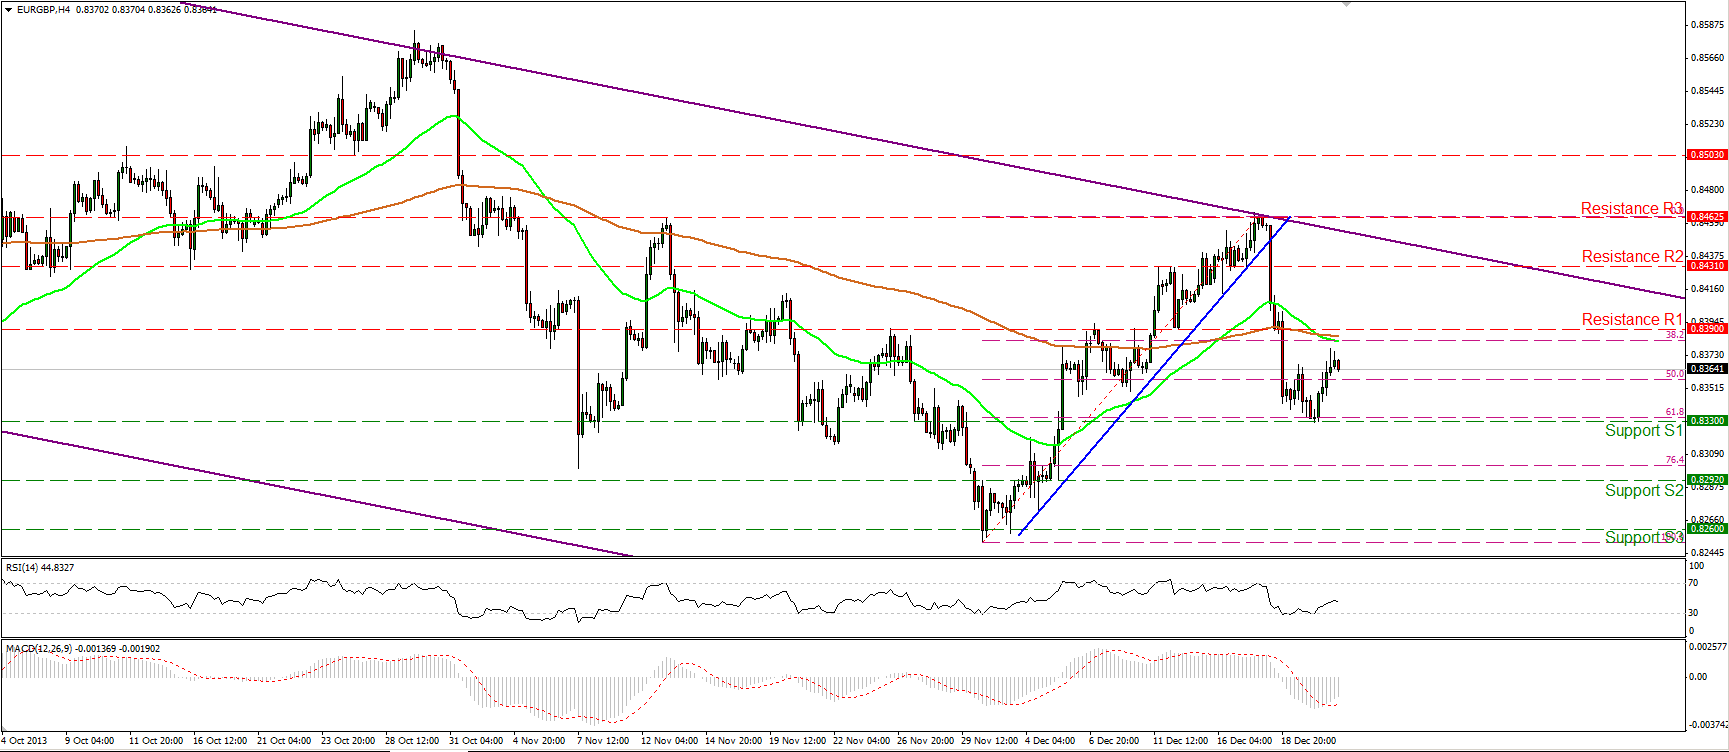 EUR/GBP Hourly Chart" title="EUR/GBP Hourly Chart" width="480" height="288">
The EUR/GBP moved higher after rebounding from the 61.8% Fibonacci retracement level of the prevailing short-term advance. However, in my view, we may see the pair weakening in the near future, since on the daily chart the rate is trading within a downward sloping channel (purple lines).The MACD oscillator crossed above its trigger line, while the RSI rebounded from its 30 level, thus I would not rule out some consolation or the continuation of the upward wave before the bears prevail again.
• Support: 0.8330 (S1), 0.8292 (S2), 0.8260 (S3).
• Resistance: 0.8390 (R1), 0.8431(R2), 0.8462 (R3).
Gold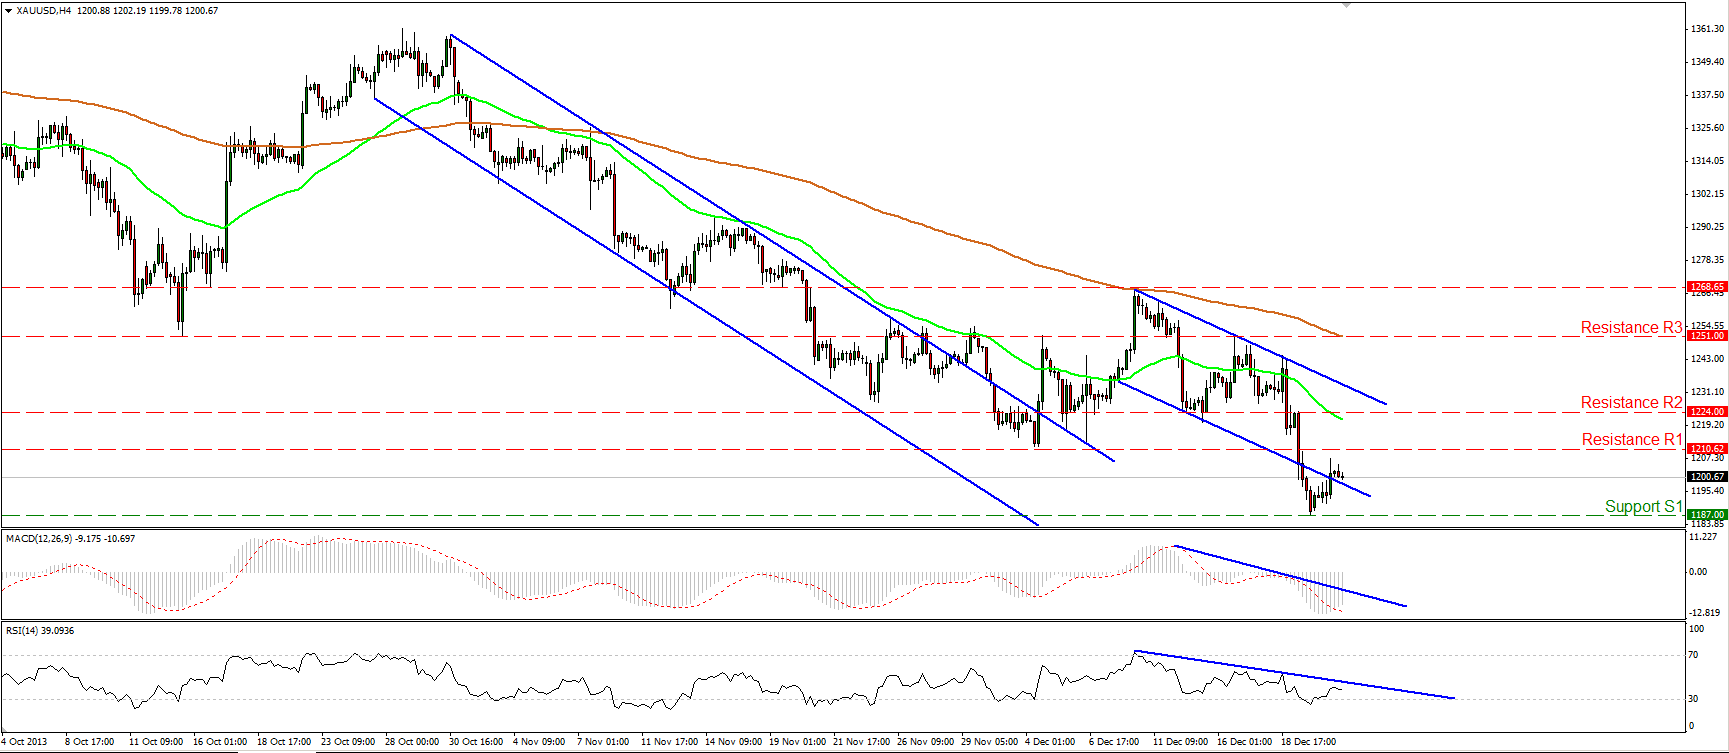 XAU/USD Hourly Chart" title="XAU/USD Hourly Chart" width="480" height="288">
Gold moved higher, confirming our expectations for an upward corrective wave. The yellow metal is back within the downward sloping channel and since it’s forming lower highs and lower lows, I consider the bias to the downside. The 50-period moving average remains below the 200-period moving average, while both momentum studies follow downward paths, completing the negative picture of the price action.
• Support: 1187 (S1), 1180 (S2), 1155 (S3).
• Resistance: 1210 (R1), 1224 (R2), 1251 (R3).
Oil
WTI moved slightly higher, but higher enough to overcome the 98.90 (S1) obstacle. During the early European morning, the price is trading near the resistance area between the 38.2% Fibonacci retracement level and the round number of 100 (R1). If the longs manage to overcome that area, they might drive the battle higher towards the next resistance at 101.10 (R2). On the other hand, a dip below the 98.90 (S1) barrier and the lower boundary of the channel may be the first sign that the recent advance was just a 38.2% retracement of the prior downtrend. As long as the 50-period moving average remains above the 200-period moving average and as long as WTI remains within the purple upward sloping channel, the bias remains to the upside, in my view.
• Support: 98.90 (S1), 97.25 (S2), 95.35 (S3).
• Resistance: 100.00 (R1), 101.10 (R2), 103.15 (R3).
BENCHMARK CURRENCY RATES - DAILY GAINERS AND LOSERS
MARKETS SUMMARY
- English (UK)
- English (India)
- English (Canada)
- English (Australia)
- English (South Africa)
- English (Philippines)
- English (Nigeria)
- Deutsch
- Español (España)
- Español (México)
- Français
- Italiano
- Nederlands
- Português (Portugal)
- Polski
- Português (Brasil)
- Русский
- Türkçe
- العربية
- Ελληνικά
- Svenska
- Suomi
- עברית
- 日本語
- 한국어
- 简体中文
- 繁體中文
- Bahasa Indonesia
- Bahasa Melayu
- ไทย
- Tiếng Việt
- हिंदी
Market Activity More Technical Than Fundemental As Holidays Approach
Published 12/23/2013, 06:13 AM
Updated 07/09/2023, 06:31 AM
Market Activity More Technical Than Fundemental As Holidays Approach
Latest comments
Loading next article…
Install Our App
Risk Disclosure: Trading in financial instruments and/or cryptocurrencies involves high risks including the risk of losing some, or all, of your investment amount, and may not be suitable for all investors. Prices of cryptocurrencies are extremely volatile and may be affected by external factors such as financial, regulatory or political events. Trading on margin increases the financial risks.
Before deciding to trade in financial instrument or cryptocurrencies you should be fully informed of the risks and costs associated with trading the financial markets, carefully consider your investment objectives, level of experience, and risk appetite, and seek professional advice where needed.
Fusion Media would like to remind you that the data contained in this website is not necessarily real-time nor accurate. The data and prices on the website are not necessarily provided by any market or exchange, but may be provided by market makers, and so prices may not be accurate and may differ from the actual price at any given market, meaning prices are indicative and not appropriate for trading purposes. Fusion Media and any provider of the data contained in this website will not accept liability for any loss or damage as a result of your trading, or your reliance on the information contained within this website.
It is prohibited to use, store, reproduce, display, modify, transmit or distribute the data contained in this website without the explicit prior written permission of Fusion Media and/or the data provider. All intellectual property rights are reserved by the providers and/or the exchange providing the data contained in this website.
Fusion Media may be compensated by the advertisers that appear on the website, based on your interaction with the advertisements or advertisers.
© 2007-2024 - Fusion Media Limited. All Rights Reserved.