A solid week for markets as they rested well until the Federal Reserve released their statement, which kept rates the same and lowered their expectations of four rate hikes this year to two, and that’s even a stretch in my view, but I’ve been wrong before.
All in all, stocks are acting great and we’re heavy into long positions and looking to hold as long as they’ll allow us, but it does look like the 2016 lows are in place and there is nowhere to go but up from here.
The metals were choppy but held key levels and still look to be setting up for higher.
I’ve had a lot of emails this week happy that I’m on the bull side once again, and others saying it doesn’t matter what I think, and I agree.
I really did think we’d have a move under $1,000 in gold to really put the panic in the perma-bulls but we only got to the $1,060 area and put in a nice base there.
The point being, it doesn’t matter what I think, nobody cares what I think, including myself.
The only thing people care about is how I interpret the action and charts, and that is often right.
I sometimes get myself into trouble with stocks by heeding my thinking instead of listening to the charts.
The charts are right, not me, and I just read them and mostly follow them, but I am human and make silly mistakes based on my thoughts sometimes.
Anyhow, the point is, listen to the charts, and right now they are telling me stocks and metals are heading higher.

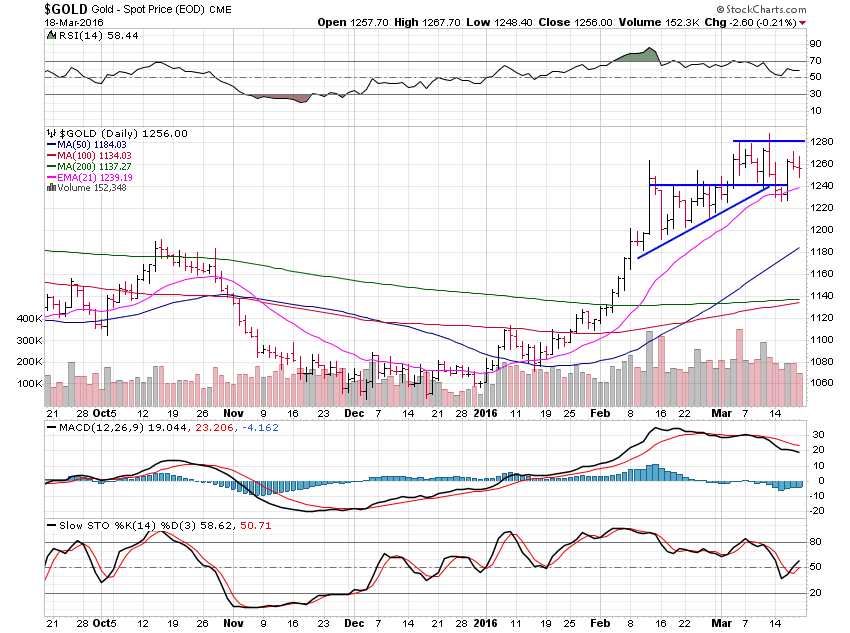
Gold rose just 0.39% for the week as it chops around.
We tested and held the 21 day average which coincides with the $1,240 support area.
A break above $1,280 remains the next buy level.
Gold continues to look good but it won’t be, nor should we want it to be, a straight moonshot.

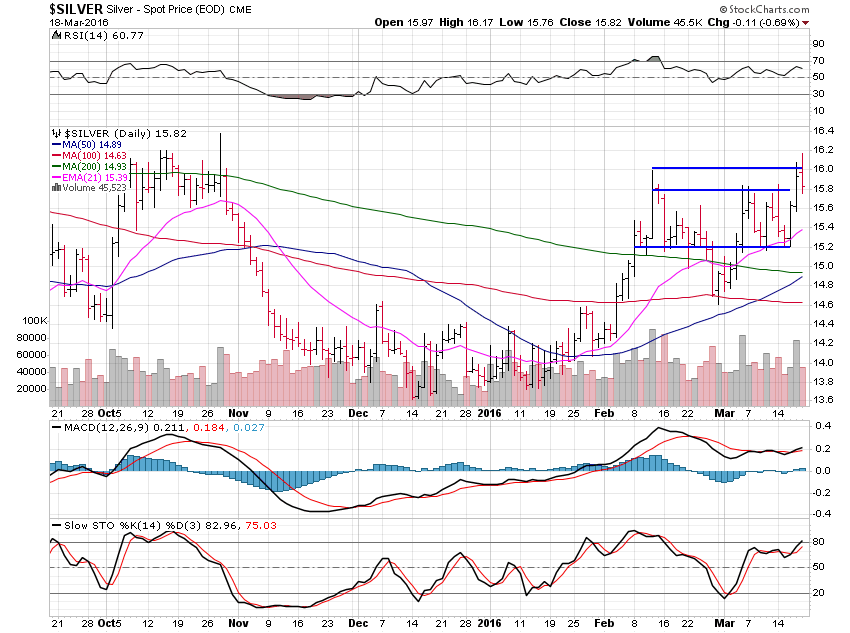
Silver gained 2.03% for the week but couldn’t breakout in the end.
I never like to see failed breakouts as we saw Friday in silver but a long as we remain above $15.20 we’re in good shape.
We tested the 21 day average and $15.20 support level well this past week and $16 is the next buy level and if a breakout above there holds on a closing basis then we should be off to the races.

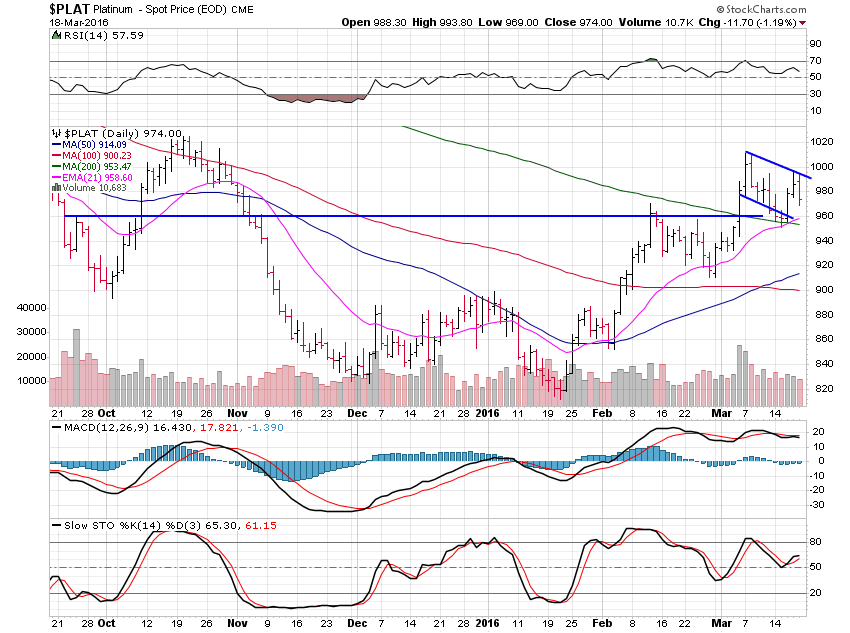
Platinum rose just 0.95% this past week.
Platinum held the important 200 day moving average as well as the 21 day average at the horizontal support level at $960.
Now we’ve got a nice bull flag that points to a breakout higher above the $990 buy area in the week ahead.
Great action for platinum who is following the gold and silver strength very well.

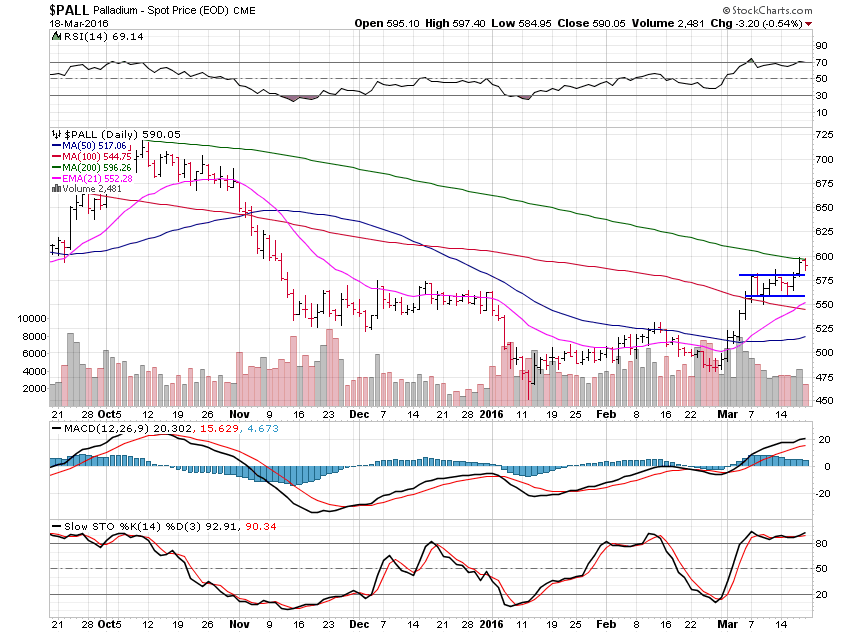
Palladium gained 2.57%, winning the week in the precious metals arena.
Palladium based very nicely just under the 200 day moving average and should have enough steam to power through that level at $600 anytime now.
Super action that should take us to $675 before we see any real consolidation.
All in all, stocks are working very well and metals are also showing nice steady and slow strength off major lows as we are now trending higher for the first time in years.