Get 40% Off
🤯 Perficient is up a mind-blowing 53%. Our ProPicks AI saw the buying opportunity in March.Read full update

Manic Monday For Stocks; Started High, Finished Low

Published 12/15/2020, 12:19 AM
Updated 09/20/2023, 06:34 AM

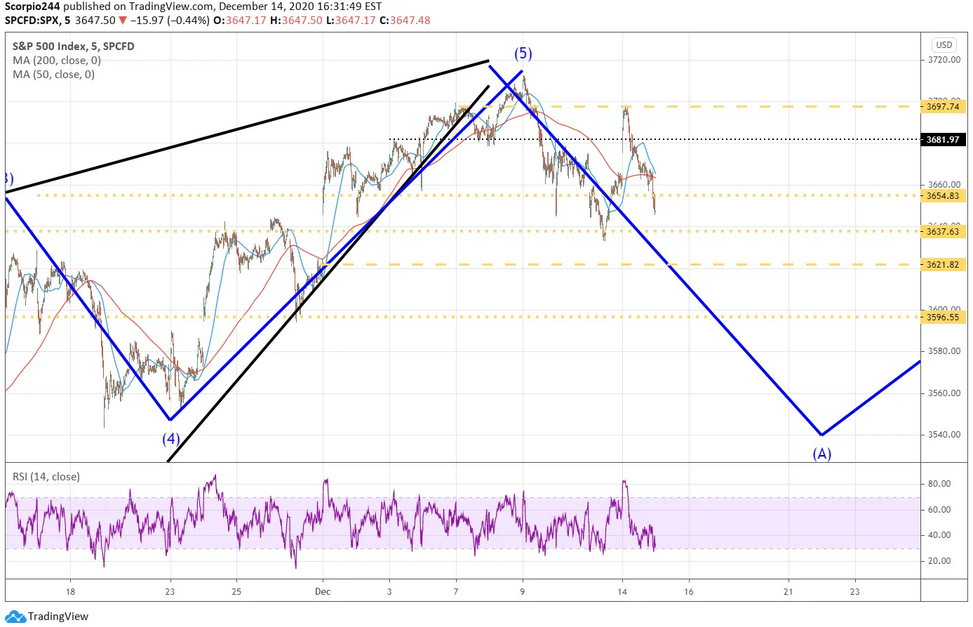
The S&P 500 finished the day lower by almost 50bps, after gapping higher by as much as 1% to start the day. It marked a 1.35% reversal from the peak to finish the day at 3,647.

I’m not sure if there was really any news that changed anything, but some blamed it on new fears of lockdowns here in the US. To this point, the market has never cared about new lockdowns. The reason for the turn lower really doesn’t matter much.

Overall, the index failed right at resistance around 3,700, filled the gap, and pushed lower. Again, as noted in my video from this weekend, 3 of 3 paths I mapped out suggested further decline for the short-term. Whether this is the start of something severe or not is too early to know.
S&P 500 Index Chart

AMD

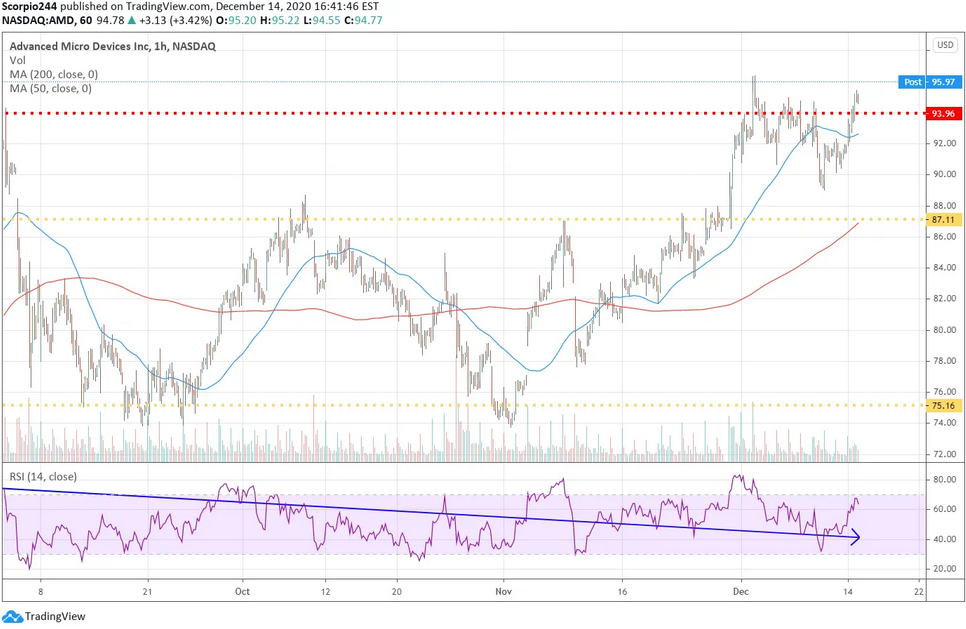
Advanced Micro Devices (NASDAQ:AMD) got an after-hours price target bump from Goldman, which pushed its target to $110 from $96 due to expanded market multiples. Yeah, sure, whatever. Regardless, the stock is getting close to breaking out of its trading range. We won’t know for sure until later today, and it will take a close above $96 to confirm that break out.
AMD 1 Hr Chart

Netflix

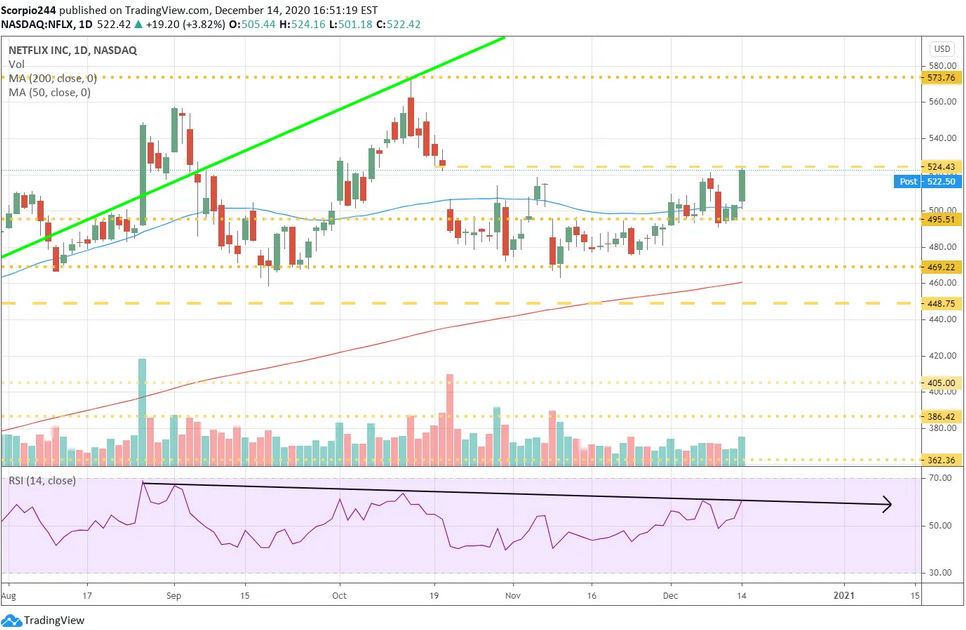
Netflix (NASDAQ:NFLX) has filled the gap at $525 and based on that, the stock should resume its trend lower. The RSI is trending lower as well, suggesting a return to $495.
Netflix Inc Chart

Broadcom

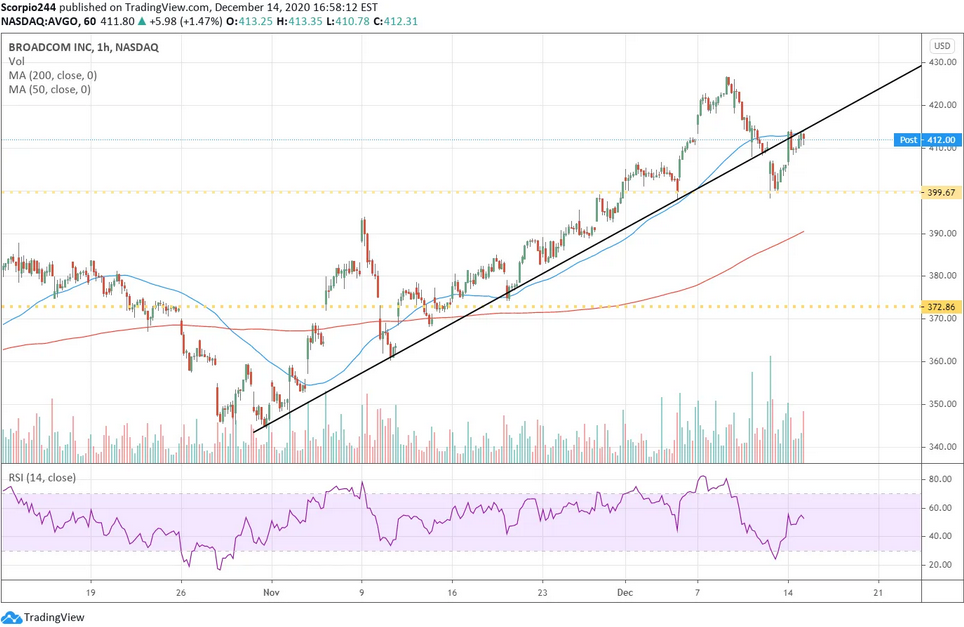
Broadcom (NASDAQ:AVGO) rose yesterday and tested the breaking of the uptrend, and failed. It should result in the stock trading lower back towards $400, as noted.
3rd party Ad. Not an offer or recommendation by Investing.com. See disclosure here or remove ads .

Broadcomm Inc 1 Hr Chart

Altria

Altria Group (NYSE:MO) may be breaking out; the stock appears to have formed an inverse hand and shoulder pattern, while breaking resistance, and a downtrend around $42, three bullish indicators. If the stock can hold on to $42, I think it has a chance of going to $47.
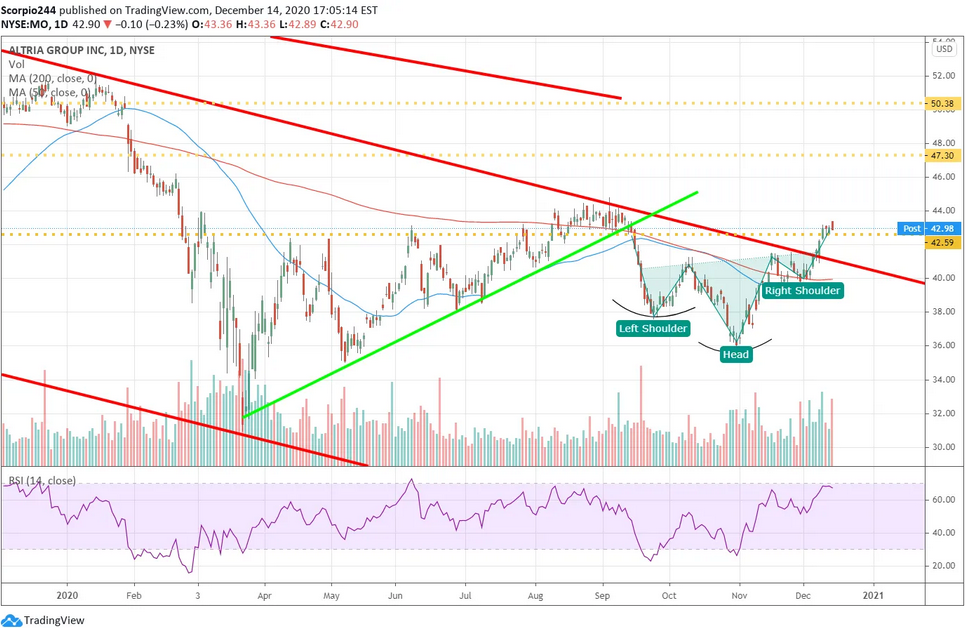
Altria Group Daily Chart

Original Post

Latest comments

Risk Disclosure: Trading in financial instruments and/or cryptocurrencies involves high risks including the risk of losing some, or all, of your investment amount, and may not be suitable for all investors. Prices of cryptocurrencies are extremely volatile and may be affected by external factors such as financial, regulatory or political events. Trading on margin increases the financial risks.
Before deciding to trade in financial instrument or cryptocurrencies you should be fully informed of the risks and costs associated with trading the financial markets, carefully consider your investment objectives, level of experience, and risk appetite, and seek professional advice where needed.
Fusion Media would like to remind you that the data contained in this website is not necessarily real-time nor accurate. The data and prices on the website are not necessarily provided by any market or exchange, but may be provided by market makers, and so prices may not be accurate and may differ from the actual price at any given market, meaning prices are indicative and not appropriate for trading purposes. Fusion Media and any provider of the data contained in this website will not accept liability for any loss or damage as a result of your trading, or your reliance on the information contained within this website.
It is prohibited to use, store, reproduce, display, modify, transmit or distribute the data contained in this website without the explicit prior written permission of Fusion Media and/or the data provider. All intellectual property rights are reserved by the providers and/or the exchange providing the data contained in this website.
Fusion Media may be compensated by the advertisers that appear on the website, based on your interaction with the advertisements or advertisers.
© 2007-2024 - Fusion Media Limited. All Rights Reserved.