I spend so much time with my hat held gently in hand, sitting politely, explaining why, yes, the market could just keep going higher – – that I’m going to break with that and actually share – – GASP – – why we might actually be heading lower. I know this is a violation of everything the world holds sacred, but let’s give this a shot.
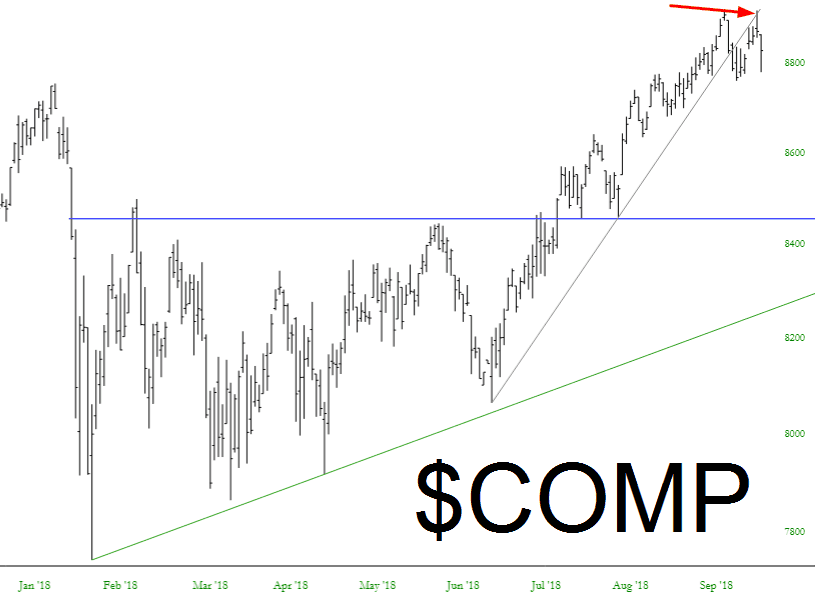
First, there is the Dow Jones Composite. It has broken its trendline. Period. This isn’t a matter of interpretation or speculation. It’s simply read. The trendline broke, and when it attempted to make (yet another) lifetime high yesterday, it was repelled by the trendline, whose job is now RESISTANCE instead of SUPPORT. That’s how trendlines work.
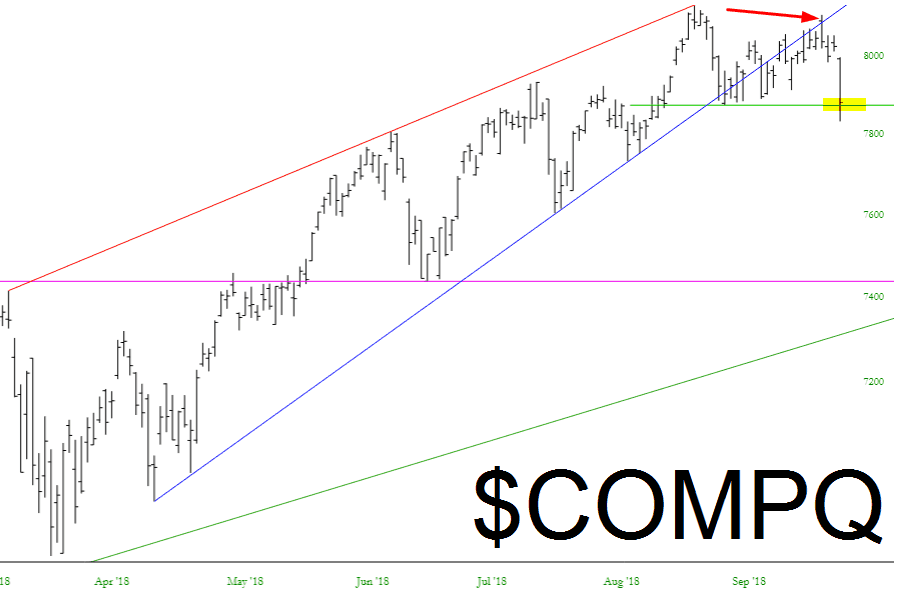
The same can be said of the NASDAQ Composite, the difference being that it was repelled a few days ago, not just yesterday. Further, and importantly, it cracked a minor supporting horizontal line (green below). A close beneath this on Friday would be importantly bearish.
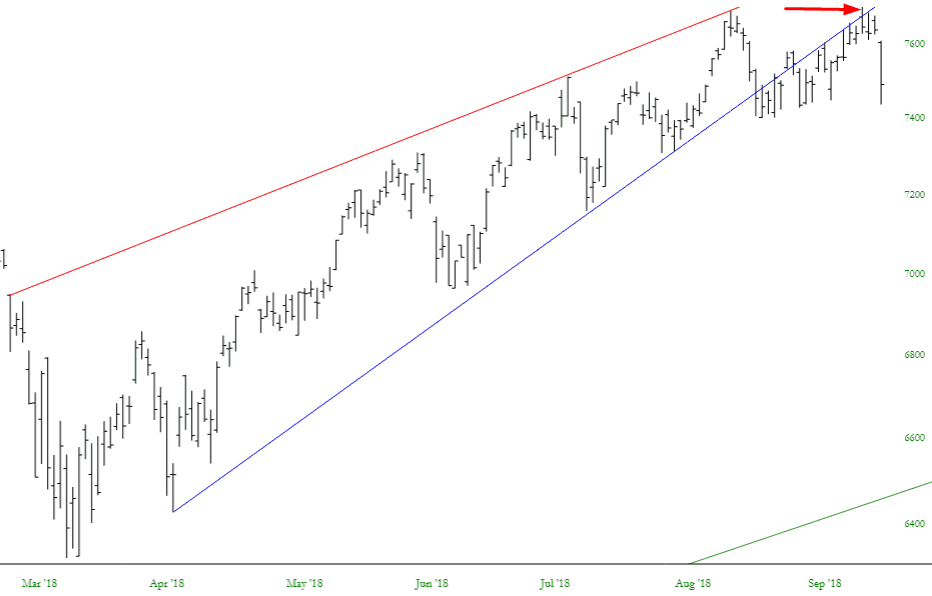
The NASDAQ 100, too, was rejected at its trendline four days ago, having failed below its wedge.
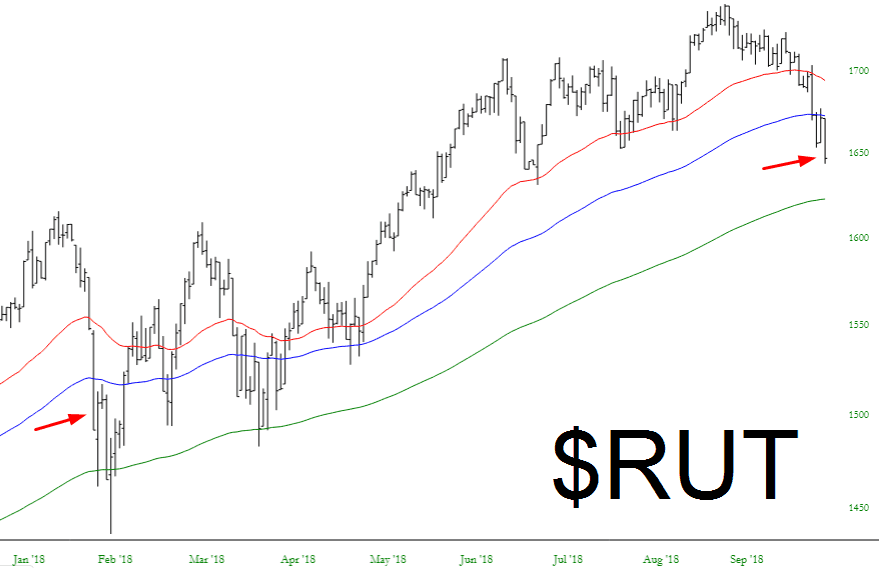
Of course, small caps have been weaker much longer than most other indexes. It has actually slipped under its 50 day and 100 day moving averages. It hasn’t behaved like this for many months.
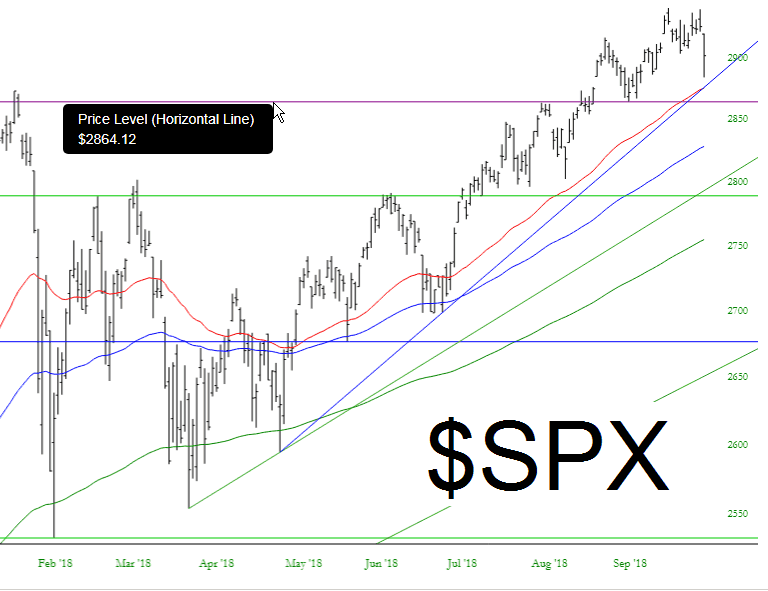
Not that all is wine and roses for the three of four bears left on the planet besides myself. Everything is still smooth sailing on the S&P 500. It needs to be 2864 on the cash index for the bears to get a true glimmer of hope.
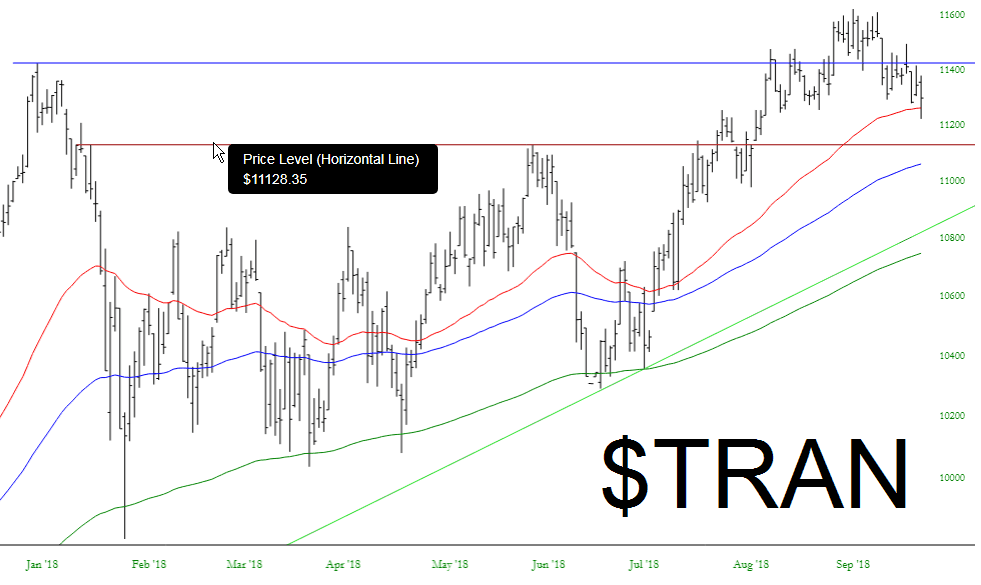
As for the Dow Transportation Index, we have a failed bullish breakout here, and we’re starting to sneak under the 50 day exponential moving average. A failure of that lower horizontal would up the odds of a more sustained break.
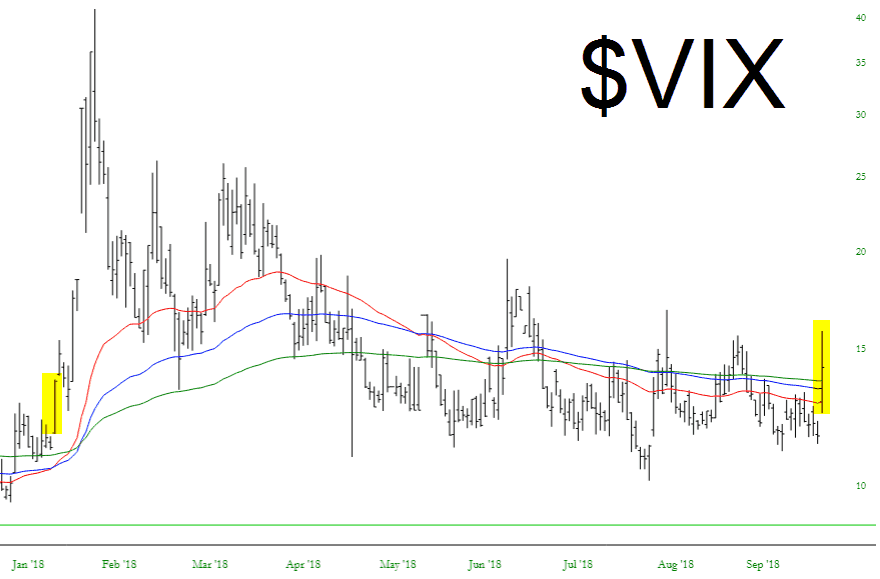
The VIX, which only yesterday was actually close to a 10-hand, briefly ripped to the mid-teens on Thursday. We’ll know on Friday if this was a one-day wonder or, like the earlier tinted area, whether it is the start of something bigger.
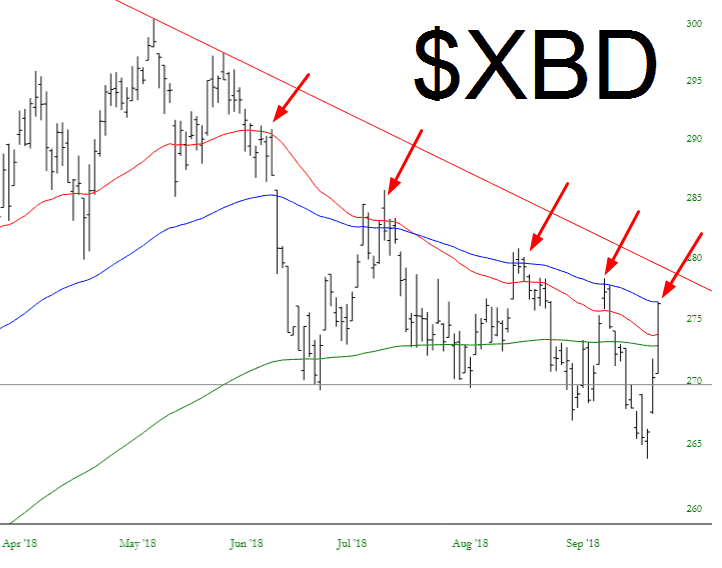
One especially fascinating chart is the broker/dealer index, which has done an incredible job getting repelled by its own moving averages.
For myself, I am very aggressively positioned with 88 shorts, although I did cover ALL of my big ETF positions at a profit (off the top of my head, NYSE:RSX, NYSE:IWM, (NYSE:SPY), NYSE:DIA, NYSE:EEM, NASDAQ:EMB, and probably some others I can’t remember). Besides these 88 individual shorts, I have 21 others I am considering.
Friday is the unemployment report, as well as the Kavanaugh vote, so it should be a news-heavy day.
