
Stocks made it clear they were not ready to decline back to the 50% Fibonacci retracement yesterday, and instead opened higher. The bulls have been patiently and slowly adding to their modest intraday gains, before losing them all in the final 45 minutes of trading. How did that change the balance of forces in the market?
S&P 500 in the Short-Run
We’ll start with the daily chart analysis (charts courtesy of http://stockcharts.com ):
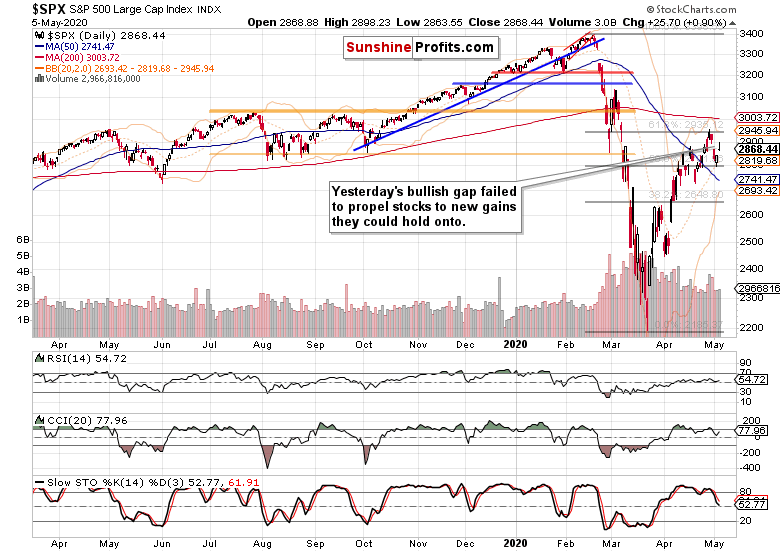
The rebound from the 50% Fibonacci retracement continued yesterday, yet not without its fair share of obstacles – the sizable upper knot shows that clearly. Regardless, the daily indicators’ posture has taken a modest turn for the better, but just as the volume level, it leans in favor of more downside.
Would the credit markets favor a downside move?
The Credit Markets’ Point of View
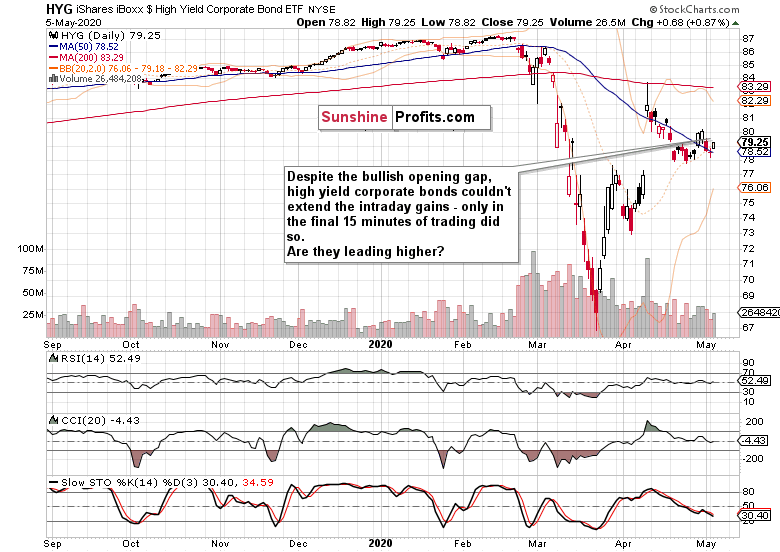
High yield corporate debt opened higher, and has seen issues keeping additional intraday gains. It only managed to do so in the final 15 minutes of trading, which doesn’t bode well for a sustained move higher in the short run. We’ll see that later in this analysis when we discuss financials (NYSE:XLF) ETF).
But it must be said that corporate junk bonds closed higher behind respectable volume, which is a sign of non-confirmation to the wavering stocks. On the other hand, investment grade corporate bonds didn’t make any headway yesterday. As both the HYG ETF (NYSE:HYG) ETF and its ratio to short-dated Treasuries (HYG: SHY) keep trading both above its recent lows and below its recent highs, only a breakout either way will bring about more clarity. In our opinion, a break to the downside is more likely – and that would point to an upcoming downswing in stocks.
Right now, all we’re seeing is back-and-forth credit market action that provides no overly clear direction for stocks in the very short run. However, the same can’t be said about sectoral analysis. Let’s dive into what the many sectors (including the message from financials) are telling us.
Key S&P (NYSE:SPY) 500 Sectors in Focus
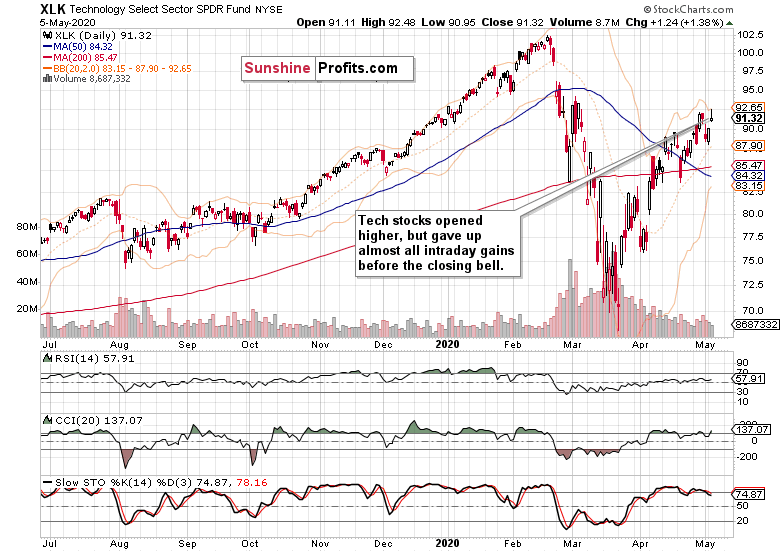
The tech sector added to its opening gains, but these evaporated before the closing bell. The daily indicators are extended, but yesterday’s volume doesn’t represent a reversal. But it’s likely that we’ll see one in the nearest sessions, because one could be pardoned for expecting stronger leadership from the tech sector. And this means that the stock bulls are skating on increasingly thin ice.
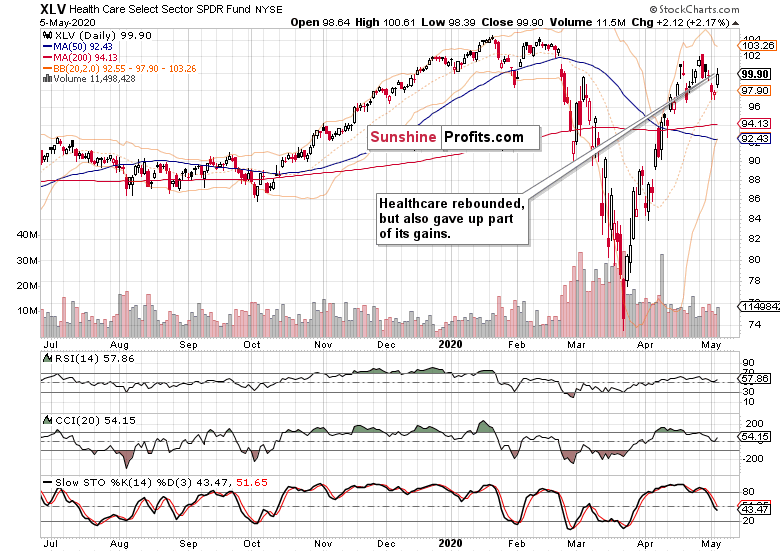
Healthcare at least managed to hold on to much of its intraday gains, but the sector is also vulnerable to a takedown. It’s true that the daily indicators are improving but they did not yet improve sufficiently to herald sectoral uptrend return. It’s high time for the story financials tell – and it’s not a bullish one.
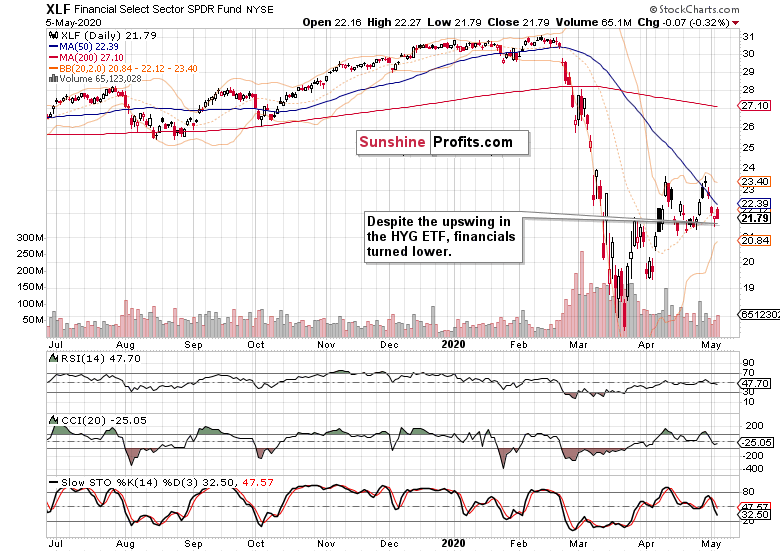
Despite the corporate debt performance, financials entirely erased the bullish opening gap. They did so on slightly higher volume and during bearish daily indicators’ posture, raising the odds of more downside to come. Coupled with the previous two S&P 500 heavyweights examination, the odds for a downswing in the entire index are alive and well.
Next, let’s discuss the stealth bull market trio of sectors (energy, materials and industrials) that are supposed to lead the index higher, if we are in a bull market, that is. Considering yesterday’s upswing in oil, energy (XLE (NYSE:XLE) ETF) could have performed better. Instead, the sector moved down from its bullish opening gap to close where it did a day ago. Not exactly a show of strength.
Materials (XLB ETF) also reversed lower yesterday. Despite keeping very modest gains from the bullish opening gap, the overall implications are near-term bearish. The very same conclusion goes for industrials (XLI ETF) or consumer discretionaries (XLY), which mirrored the action in materials.
Interestingly, consumer staples (XLP ETF) or utilities (XLU ETF) also ran into similar issues. It certainly doesn’t bode well for stocks overall that not even the defensive sectors perform.
Our yesterday’s observations proved correct:
Overall, the sectoral analysis speaks in favor of a short-term pause in the S&P 500 downswing, and the $64,000 question is when will the move lower continue in earnest.
Today, we would add that the bulls will face a harder time keeping or extending gains. The 61.8% Fibonacci retracement is relatively near (around 2935), if they can make it there at all. If we take a close look at the daily S&P 500 chart again, we see rising volume around the local tops, with the volume on the upswings quite far from matching it. This speaks subtly in favor of being in the latter stages of a sharp bear market rally, which is confirmed by the wobbling stealth bull market trio of sectors.
Summary
Summing up, stocks extended gains from the 50% Fibonacci retracement rebound, and the credit markets improved yesterday. That would speak for the S&P 500 upswing to continue, but the sectoral performance doesn’t confirm that at the moment. While the bulls’ standing improved since the start of Monday’s trading, the risks continue being skewed to the downside. This is confirmed by the daily volume examination – regardless of the back-and-forth trading of the day, it appears we’re in the early stages of the S&P 500 downswing and our short position remains justified.