
Last week was another positive week for stock markets and the Canadian dollar. Our loonie and the U.S. stock markets took off on Friday after the release of U.S. employment data, which shattered all the analysts’ expectations. Our neighbours to the south managed to create 243,000 jobs in January; whereas analysts had been expecting only 150,000. This good news, combined with a better than expected ISM index (56.8 vs. 53), allowed the loonie to take wing, and end the day in strength. With the host of major economic statistics released last week in the U.S., investors were completely focused on that region. This week our attention will be on the other side of the Atlantic, with the decisions to be made by various European central banks. Here are some highlights of the economic news expected this week
Canada
The pickings will be slim this week in terms of Canadian economic news. On Monday we are expecting the Ivey Purchasing Managers’ Index and housing starts data for the month of January. Housing starts are expected to be 191,500, compared to 200,200 in December.
United States
The week will be as short on statistics in the U.S. On Friday we can expect the Michigan Consumer Sentiment Index, the Trade Balance and the monthly budget statement.
International
In international news there will be many statistics and meetings that could affect markets this week. Australia will reveal its decision on its key interest rate. The market is expecting the central bank to drop its rate by 0.25% for the third consecutive time. On Thursday, we are expecting China’s Consumer Price Index and Producer Price Index. Thursday will also be an important day due to interest rate decisions from the Bank of England and the European Central Bank. Analysts will be scrutinizing the press releases issued following these meetings. As for England, we will see whether it will continue to pursue its bond purchasing program. Also in European news, Mario Draghi, who succeeded Jean-Claude Trichet at the helm of the European Central Bank in November 2011, is sure to give us a hint of the central bank’s intentions after 25 of the European Union’s 27 member states signed a fiscal pact on January 30th. We await the results of China’s trade balance and Germany’s consumer price index on Friday. No bond issues are expected from eurozone countries this week. That being said, investors will surely focus on the central bank meetings as well as developments in Greece’s negotiations with its creditors. Have a great week!
The Loonie
“I believe in looking reality straight in the eye and denying it.”
On Tuesday, January 31, Statistics Canada surprised everyone when it announced that real GDP had fallen 0.1% in the month of November. The market had expected a 0.2% increase. This drop was due to a strong decline in the Energy and Mines sectors, a mediocre result for the last six months. Industrial production and wholesale trade posted slight declines.
If we take the analysis a bit farther, with no growth in October and negative forecasts for December due to discouraging retail sales results, GDP for the fourth quarter of 2011 will be negative. Does this mean we are entering a recession? In any event, if the trend continues the first quarter of 2012 may officially confirm that we are in a recession, following two negative quarters. A recession is defined as a sustained and generalized decrease in economic activity, and GDP is our most important indicator of economic activity. The last recession was in May 2009 (see the following chart).
Moreover, even if it is determined that we are not in a technical recession, economic growth will certainly have slowed in the last quarter of 2011. According to the graph below, the Canadian dollar has tended to rise against the U.S. dollar since 2002 with the exception of the 2008 financial crisis, when the greenback regained its status as a safe haven. U.S. employment figures released on Friday far exceeded expectations. This raises the issue of what direction our loonie will take, as it no longer seems that it will be supported by solid economic growth. Will the trend that began in 2002 continue, or are we witnessing a change in direction? Maybe our loonie has begun to lose altitude; we will see over the next few months.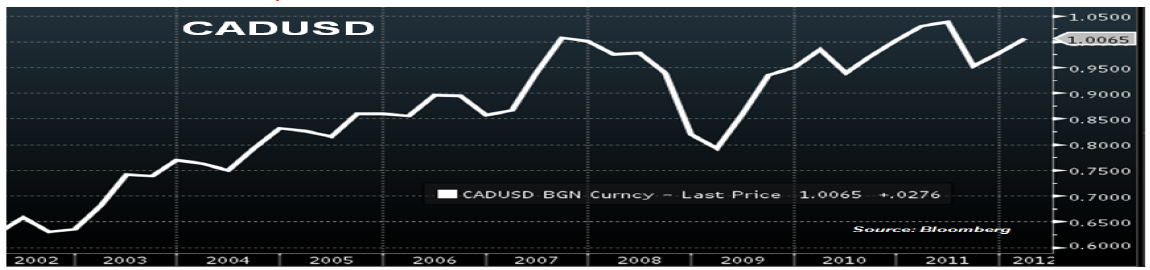 CAD/USD" title="CAD/USD" width="1150" height="270">
Last Week at a Glance
Canada – According to the Labour Force Survey, Canadian employment rose just 2K in January, well below consensus expectations for a 22K gain. The unemployment rate rose one tick to 7.6%. The job gains were all in goods-producing industries (+9.3K), with gains in all subcategories except construction. Services lost 7K jobs including the 23K in the FIRE category and 45K in professional services, those more than offsetting gains in education, trade and info/culture. Full time employment fell 3.6K adding to the losses in December, while part-time employment added 5.9K (although we still haven’t recovered from November’s massive 57K drop in PT employment). Private sector employment rose for the third consecutive month (+ 19.7K). While the overall report was disappointing, the details were a bit better. Note that much of the weakness came from the self employment category (-37K). Paid employment was in fact up 39K (the best tally since June 2011), with a third straight increase in private sector employment. That's somewhat comforting and consistent with economic expansion. Canadian GDP surprised to the downside in November, falling 0.1% (versus the +0.2% that consensus expected). The goods sector contracted for the second consecutive month primarily due to the 2.5% drop in oil and gas output (reportedly due to maintenance shutdowns). Utilities contracted for the second month in a row in part due to a warmer than seasonal weather. Construction also saw weaker output for the second month running. Those losses more than offset the increased output in manufacturing and mining (latter's output rose for the first time in three months). The services sector’s output expanded 0.1% in the month helped by retailing and accommodation/food services among others which more than offset the decline in wholesaling. With November’s decrease, Q4 GDP is tracking roughly 1.5% annualized, a bit below the BoC’s estimates of 2%. But don't expect Governor Carney to change his stance based on that report alone. There were special and temporary factors at play in November.
The maintenance-related shutdowns (which limited oil and gas output) and mild weather (which impacted utility output) have little to do with the state of the economy. United States – The US labour market added 243K jobs in January according to the non-farm payrolls survey, more than 100K higher than consensus expectations. In January, revisions were made to reflect updated seasonal adjustment factors and an annual benchmark adjustment. So, after revisions, in 2011 there were 1.9 million jobs created in the US (versus old estimate of 1.6 million). The private sector added 2.2 million (versus the old estimate of 1.9 million). Private sector employment expanded by 257K jobs in January, following a strong 220K gain, with both the goods and services sectors providing jobs. Government continued to shed jobs in January (-14K). Average hourly earnings rose 0.2%, while hours worked per week was flat at 34.5. Separately, the household survey showed 847K new jobs created. Note that the January data was estimated using population controls reflecting Census 2010, and are therefore not directly comparable to data in prior months. Those gains were enough to lower the unemployment rate two ticks to 8.3%. That's the lowest since February 2009. The non farm and household surveys are unambiguously bullish and consistent with the declining jobless claims that we've been observing. The private sector has created 840K jobs in the last three months alone according to the non farm payrolls. Aggregate hours are up 2.7% so far in Q1, a deceleration from Q4's 4.5% but consistent with decent growth in the first quarter of Q1. The wage gains will bring some support to consumption spending, a positive for the broader US economy. Personal income grew 0.5% in December, topping consensus expectations for a 0.4% increase. Personal spending was flat, and one tick below consensus estimates. With income rising faster than spending, the savings rate shot up five ticks to 4%, the highest since August. In real terms, spending fell 0.1%, although it remains healthy on a 3-month annualized basis at 2%.
Real disposable income rose 0.3% in December. While the moderation in spending in December will get bears all excited, that has to be looked at cautiously because it comes after three consecutive healthy months. Moreover, consumer mood may have been impacted by Congress-related uncertainties in the month. We don't see the December dip to be the start of a trend, particularly given the strong gains in incomes, employment and savings. The PCE deflator, preferred by the Fed over the CPI in gauging inflationary pressures, fell two ticks to 2.4% on a year-on-year basis in December. That was a bit higher than consensus expectations. The core PCE deflator rose 0.2% in the month (double consensus expectations), taking the year-on-year rate up one tick to 1.8%. Despite the hotter-than-expected December prices, the PCE deflator remains quite tame at this point, allowing the Fed flexibility in providing more monetary stimulus if deemed necessary.The Conference Board's index of consumer confidence fell unexpectedly to 61.1 in January (from an upwardly revised 64.8). While the "expectations" component fell only marginally, the "present situation" index saw a large decline to 38.4 (from 46.5). Consumers may have been bothered by Congress dithering on the payroll tax cut extensions in December.The ISM manufacturing index rose a full point to 54.1 in January from a downwardly revised 53.1. The new orders component of the index soared to 57.6, the highest since April 2011. The production index dropped three points to 55.7 while the employment index fell marginally to 54.3 (both of those are still in expansionary territory though). The now leaner and more competitive US manufacturing sector is on a clear uptrend. Forward-looking indicators like the new orders component of the ISM bode well for production going forward. The January reading is in line with our expectations that the US expanded at a 2% or so pace in Q1.US business non-farm labor productivity rose 0.7% annualized in the final quarter of 2011, one tick below consensus expectations. The prior quarter was revised down four ticks to 1.9%. The Q4 advance was a result of output (+3.6%) growing a bit faster than hours worked (+2.9%). Unit labour costs rose for the first time in three quarters with a +1.2% print. The productivity gains, while not stellar, are a positive for corporate profits and hiring capabilities.The Fed’s Senior Loan Officer survey showed that domestic banks had experienced somewhat stronger loan demand in Q4. On the household side, lending standards and demand for loans to purchase residential real estate were reportedly little changed over the fourth quarter on net. The report shows that credit markets remain functional in the U.S.
Euro area – A European fiscal compact was presented this past week. According to the new fiscal compact, “national budgets are required to be in balance or in surplus, a criterion that would be met if the annual structural government deficit (i.e. one that accounts for the business cycle) does not exceed 0.5% of nominal GDP”. This balanced budget rule must be incorporated within one year into the member states' national legal systems, at constitutional level or equivalent. The EU Court of Justice will be able to verify national transposition of the balanced budget rule. Its decision is binding, and can be followed up with a penalty of up to 0.1% of GDP, payable to the European Stability Mechanism. A target for the structural deficit (rather than the overall budget deficit) provides some room to manoeuvre. In our view, this measure provides enough flexibility to make it palatable to the politicians that must get the accord ratified by their respective governments. This rule is unlikely to provoke a worsening of current austerity measures. For the zone as a whole we note that the current cyclically adjusted deficit is currently expected to be around 1.5% in 2012 and to be near the target of 0.5% in 2013 according to the OECD. There were some data releases that suggest the eurozone’s GDP contracted in the final quarter of 2011. Spanish GDP shrunk over 1% annualized in that quarter after staying flat in Q3. German retail sales fell 1.4% in December, following a 1% drop in November. Overall, Eurozone retail sales dropped 0.4% in December following a similar decline in the prior month. The zone’s unemployment rate was unchanged at 10.4% in December.There were, however, some positive readings out of Europe for early 2012. German unemployment rate managed to drop to 6.7% in January (the lowest in over two decades) and the UK’s manufacturing PMI rose more than two points in January to 52.1, i.e. in expansionary territory.
Technical Analysis:
USDCAD: the pair closed below its well watched 200-d moving average sitting at 0.9964. This morning rebound is weak but many indicators are now in overbought territory (RSI, stochastics…). Another clear close below the moving average would send a strong sell signal.
Gold: $1,755 target reached. A sharp sell-off followed that sent gold to the lower band of its medium term uptrend channel at $1,710.
EURCAD: Downtrend is back after the 1.3250 target was reached.
Oil: Chart below. Support at $97.70 was breached then retested The downtrend could continue towards $92.55.

Commodities
Greater crude oil inventories in North America and increased demand in Asia widened the spread between the price of North Sea oil (Brent) and oil from Texas (WTI). The difference between these two indices is now over $16/barrel, but this is still far below the record $27.88 recorded on October 14, 2011. The greater spread between these two indices is also due to the political tensions surrounding Iran. Good U.S. employment statistics reported on Friday also helped drive up fuel prices. Despite this news, the price of crude oil remains below US$100/barrel, while the Canadian dollar is trading above parity. These two factors have rendered heating oil hedges more attractive. Many of our clients have taken advantage of this opportunity.
Fixed Income
Government bond yields continued their declines early last week, before rebounding and closing Friday’s session sharply higher in response to the release of better-than-expected employment figures in the United States.
On Monday, the latest US GDP and consumer confidence indexes disappointed investors, causing a gradual decline in long-term rates until Wednesday.
The situation reversed on Friday after the release of important employment numbers. The U.S. economy created nearly two times more jobs than anticipated in January, and the unemployment rate fell 0.2%. Investors were obviously surprised by these numbers, and over the week-end, some of them were even questioning the recent promise of low interest rates by the Fed.
After the US and Canada, it is now time for three other central banks to announce their rate decision this week: UK, Europe and Australia. It will be interesting to see if the loose monetary conditions that prevail in North America will be extended to these countries, who share similar economic challenges.
- English (UK)
- English (India)
- English (Canada)
- English (Australia)
- English (South Africa)
- English (Philippines)
- English (Nigeria)
- Deutsch
- Español (España)
- Español (México)
- Français
- Italiano
- Nederlands
- Português (Portugal)
- Polski
- Português (Brasil)
- Русский
- Türkçe
- العربية
- Ελληνικά
- Svenska
- Suomi
- עברית
- 日本語
- 한국어
- 简体中文
- 繁體中文
- Bahasa Indonesia
- Bahasa Melayu
- ไทย
- Tiếng Việt
- हिंदी
Major News to Look for This Week
Published 02/07/2012, 05:17 AM
Updated 05/14/2017, 06:45 AM
Major News to Look for This Week
Latest comments
Loading next article…
Install Our App
Risk Disclosure: Trading in financial instruments and/or cryptocurrencies involves high risks including the risk of losing some, or all, of your investment amount, and may not be suitable for all investors. Prices of cryptocurrencies are extremely volatile and may be affected by external factors such as financial, regulatory or political events. Trading on margin increases the financial risks.
Before deciding to trade in financial instrument or cryptocurrencies you should be fully informed of the risks and costs associated with trading the financial markets, carefully consider your investment objectives, level of experience, and risk appetite, and seek professional advice where needed.
Fusion Media would like to remind you that the data contained in this website is not necessarily real-time nor accurate. The data and prices on the website are not necessarily provided by any market or exchange, but may be provided by market makers, and so prices may not be accurate and may differ from the actual price at any given market, meaning prices are indicative and not appropriate for trading purposes. Fusion Media and any provider of the data contained in this website will not accept liability for any loss or damage as a result of your trading, or your reliance on the information contained within this website.
It is prohibited to use, store, reproduce, display, modify, transmit or distribute the data contained in this website without the explicit prior written permission of Fusion Media and/or the data provider. All intellectual property rights are reserved by the providers and/or the exchange providing the data contained in this website.
Fusion Media may be compensated by the advertisers that appear on the website, based on your interaction with the advertisements or advertisers.
© 2007-2024 - Fusion Media Limited. All Rights Reserved.