Major Asset Classes | Correlations Profile | 30 April 2019
Do lower and negative correlations between markets enhance diversification for building diversified portfolios and (potentially) earning higher risk-adjusted returns? If the answer is “yes,” Mr. Market has become moderately more generous in spots in recent months by expanding the opportunity set of relatively low and negative correlations across asset classes.
Skeptics will note, correctly, that quantifying the degree of diversification (or the lack thereof) in assets is a task that requires looking beyond correlation through the lens of the rear-view mirror. Nonetheless, this metric is a reasonable first approximation for measuring the relationship between markets in recent history.
Mindful of the limitations, let’s review the correlation profile for a broad set of ETFs in recent history and compare how the numbers have evolved since a previous update from last October. As before, we’ll focus on funds that represent the major asset classes.
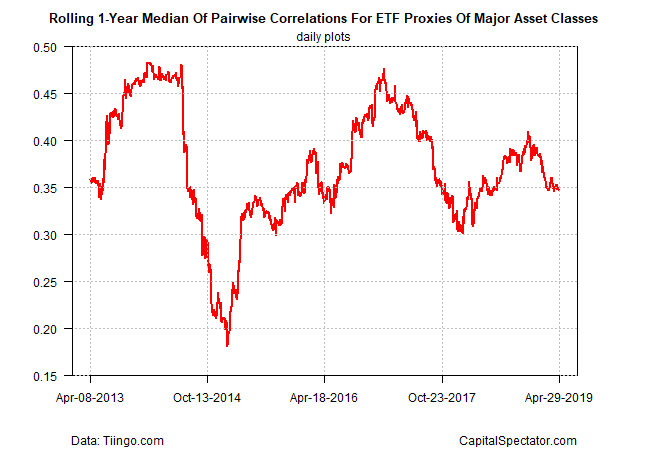
Let’s begin by noting that the median correlation for the major asset classes has remained relatively stable at roughly 0.35 through yesterday’s close (Apr. 29), based on daily returns for the latest one-year rolling period (252 trading days). That’s a bit lower compared with levels posted in the last several years, although in late-2014 there was a brief period when this measure dipped below 0.20. Note: correlation readings range from -1.0 (perfect negative correlation) to zero (no correlation) to +1.0 (perfect positive correlation.)
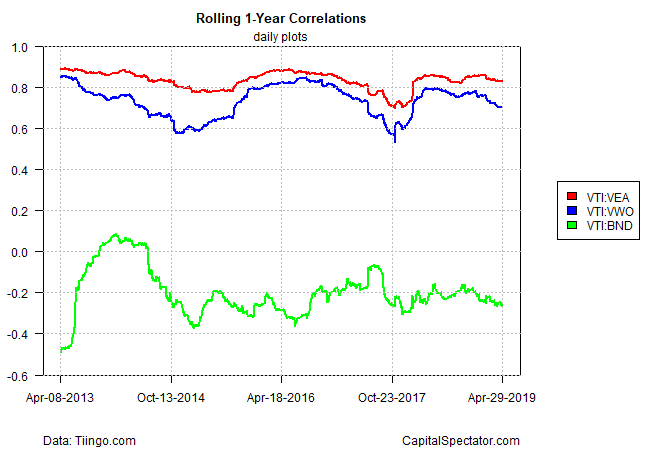
For a slightly more granular profile, we can monitor the evolution of correlations between the US stock market vs. foreign equities in developed and emerging markets and vs. US bonds. A the chart below shows, the correlations have been ticking down recently. For example, the rolling one-year correlation (via daily returns) for Vanguard Total US Stock Market (VTI) vs. Vanguard FTSE Emerging Markets (NYSE:VWO) slipped to 0.70, the lowest reading in over a year.
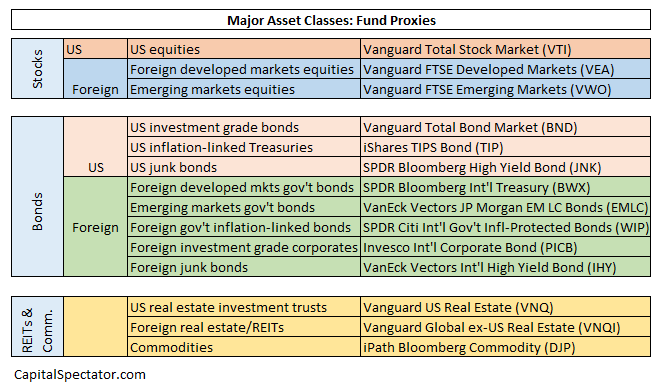
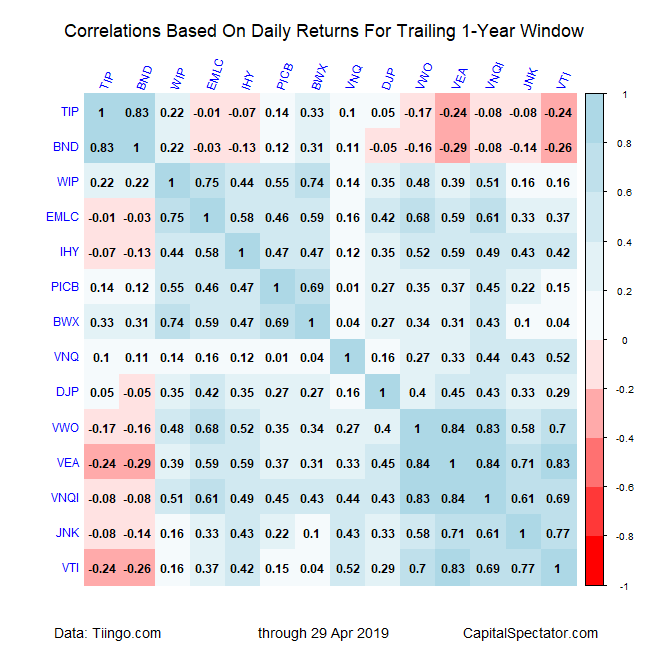
For a deeper review of correlations, let’s turn to the complete dataset for all the major asset classes, based on the following proxies:
Based on the funds listed above, most of the correlations are positive in varying degrees. Note, however, that there are pockets of relatively low and negative correlations. In some cases, the negative correlations have edged down a bit relative to our update from last October. For example, the trailing one-year correlation (via daily returns) for inflation-indexed Treasuries (TIPS) and foreign developed-market stocks (VEA) ticked down to -0.24.
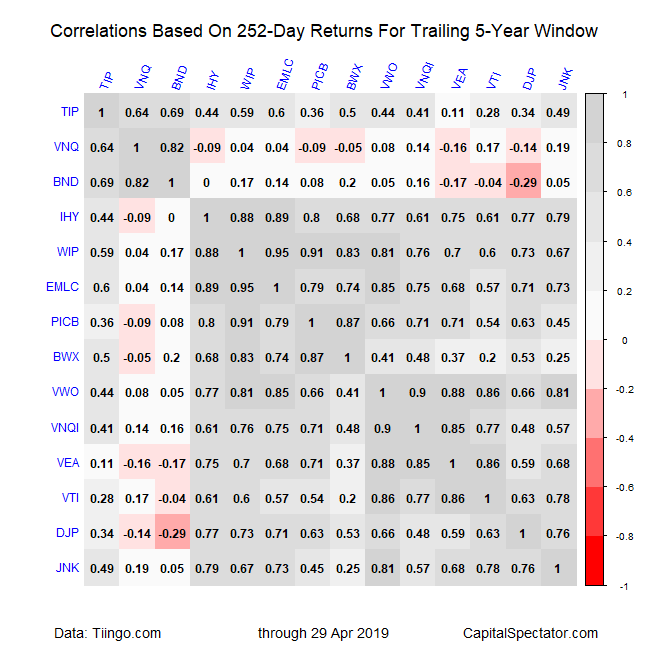
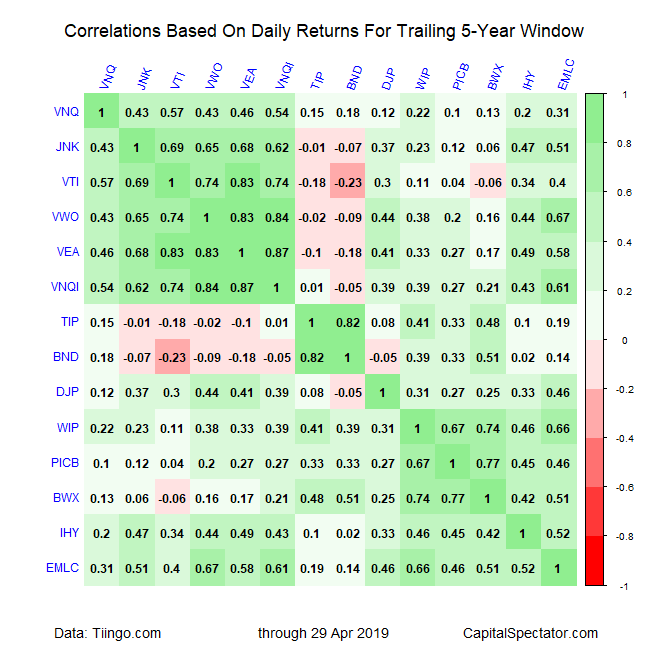
The next table below organizes all the pairwise correlations based on daily returns for the current five-year trailing window. On this front, the connection between US stocks (VTI) and bonds (NYSE:BND) leads the way for relatively deep negative correlations at -0.23.
Finally, let’s look at another perspective using rolling one-year returns (252 trading days) to calculate correlations for the trailing five-year period through yesterday. By this definition, correlations have trended up a bit since our last update in October. The deepest negative correlation at the moment: broadly defined commodities (NYSE:DJP) and US bonds (BND): -0.29.