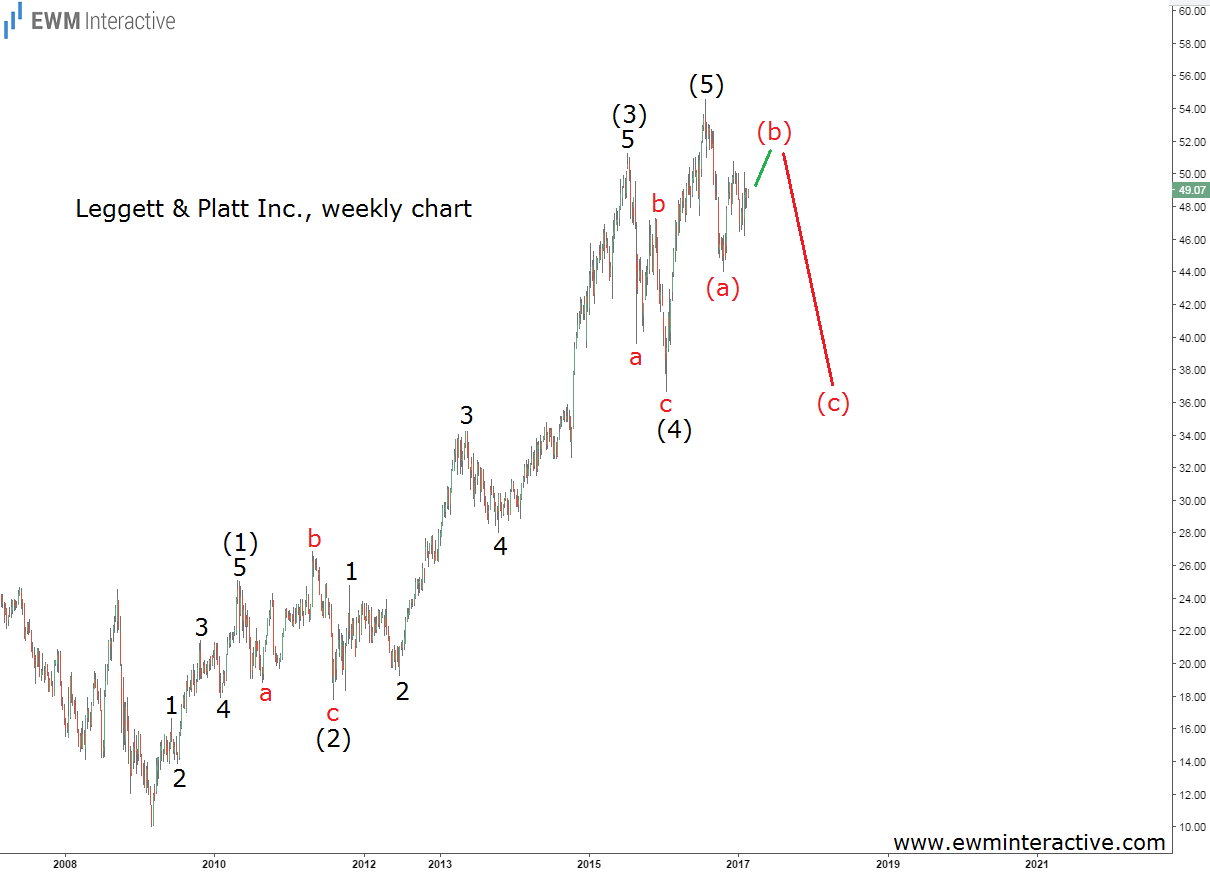
Less than two years ago, in February 2017, the price of Leggett & Platt (NYSE:LEG) shares was hovering above $49 a share. LEG stock was still thought to be in an uptrend, following a steady rally from $10.03 in March 2009.
However, stocks get more risky as they rise, not less. Following a 400% rally in just 8 years, many might have started thinking LEG was a sure bet. Unfortunately, as the great Peter Lynch once wrote, “stocks are most likely to be accepted as prudent at the moment they’re not.”
So instead of joining LEG stock bulls above $49 a share, we decided to put our Elliott Wave glasses on. As it turned out, while everyone was still in love with Leggett & Platt, its weekly chart already had “danger” written all over it.
This chart was included in an article called “Leggett & Platt Not Done Falling”, published on February 27th, 2017. It revealed that LEG’s entire rally from $10 to almost $55 had the structure of a textbook five-wave impulse. The five sub-waves of (1) and (3) were also clearly visible. In addition, waves (2) and (4) obeyed the guideline of alternation. Wave (2) was a sideways expanding flat correction, while wave (4) was a sharp zigzag.
LEG Stock Not a Wall Street Favorite Anymore
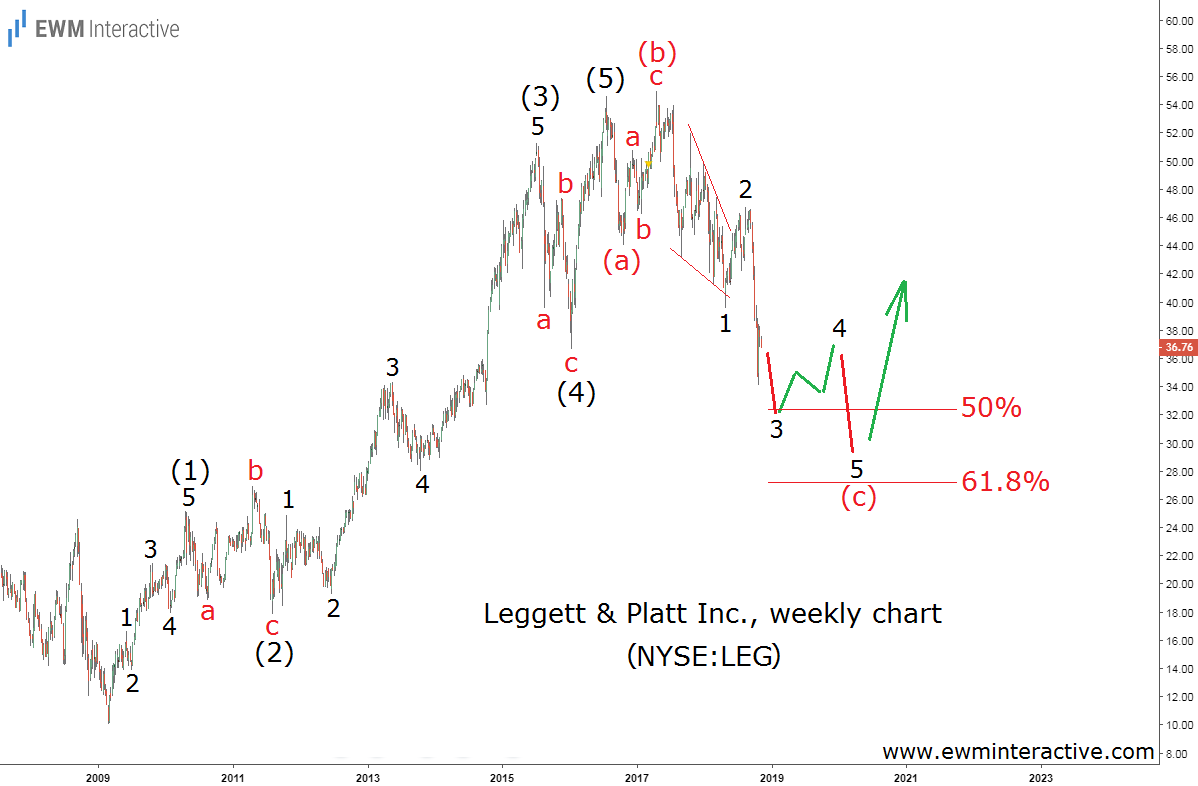
The reason for our pessimism rooted in the Elliott Wave postulate that a three-wave correction in the opposite direction follows every impulse. Since wave (5) seemed to be over already, we thought a three-wave decline to the support of wave (4) can be expected in LEG stock. The updated chart below shows the suffering Leggett & Platt investors had to go through recently.
Wave (b) led LEG stock to a new all-time high of $54.97 in April 2017, only to make wave (c) even worse. The share price fell to as low as $34.07 last month, which translates into a 38% selloff in just 18 months. Fortunately, Elliott Wave analysis helped us dodge that bullet.
What to expect from now on? Well, the new high in wave (b) means LEG stock is most likely drawing an expanding flat correction. Wave (c), currently in progress, needs to evolve into a complete impulse pattern. Waves 4 and 5 of (c) are still missing so it makes sense to expect more weakness in the mid-term. The support area near the 61.8% Fibonacci level is a reasonable bearish target.
On the other hand, once the stock approaches $30 a share, we should get ready for a bullish reversal. Leggett & Platt is a profitable company, which managed to maintain revenue growth despite all the headwinds in the industry. The current weakness looks like the opportunity long-term investors have been waiting for.
