Semiconductor equipment maker KLAC Corporation (NASDAQ:KLAC)) stock made new all-time highs of $359.69 on April 5, 2021, as the NASDAQ 100 rallied back from correction territory. The Company is a pandemic and post-pandemic winner. Stay-at-home mandates accelerated the demand for consumer electronics and computing devices far outstripping the chip supply as evidenced by the shortage during the re-opening recovery. The shortage has led to companies scaling back their financial guidance as underscored by warnings from Ford Motor (NYSE:F) in the auto sector. More chip demand means more demand for the precision equipment needed to test and manufacture the chips. This is a boon to KLA Corp. as one of the leading makers of the highly specialized machines needed to ensure the quality of these complex products. The Company gained a market share of the semiconductor metrology and inspection equipment segment in 2020 to 58% dominating its rival Applied Materials (NASDAQ:AMAT) which holds a 12% market share. Prudent investors looking for exposure in a direct beneficiary of the chip shortage can monitor shares for opportunistic pullback levels.
Q2 Fiscal 2021 Earnings Release
On Feb. 3, 2021, KLAC Corp. reported its Q2 2021 results for the quarter ending December 2020. The Company reported earnings-per-share (EPS) of $3.24 versus consensus analyst estimates for $3.21, a $0.03 beat. Revenues grew 9.4% year-over-year (YoY) to $1.65 billion, beating analyst estimates for $1.60 billion. Customer segment mix was foundry at 49%, logic at 10% and memory at 32% (noting a 41% growth in memory). The memory segment was split 60% NAND and 40% DRAM. The Company will report foundry and logic segments under one combined category moving forward, for reporting purposes.
Q3 Fiscal 2021 Guidance Raised
The Company raised guidance for Q3 fiscal 2021 expecting EPS to come in between $3.23 to $3.91 versus analyst estimates of $3.22. Revenues are expected to come in between $1.665 billion to $1.815 billion versus $1.61 billion consensus analyst estimates.
Conference Call Takeaways
KLA Corp. CEO, Rick Wallace, set the tone, “In the December quarter, we saw a diversified strength across each of our segments. Semiconductor Process Control revenue was once again above plan. The Electronics, Packaging, and Components group met its target and our Services business continued and delivered another quarter of growth and strong operating leverage. We ended the year with strong backlog setting the stage for double-digit growth in 2021 as we continued to execute at a high level.” CEO Wallace highlighted the powerful growth drivers, “The digital transformation is enabling secular demand drivers such as high performance computing, artificial intelligence and rapid growth in new automotive electronics, and 5G communications markets. Each of these secular trends are driving investment and innovation in advanced memory and logic semiconduction devices, as well as new and increasingly more complex advanced packaging and PCB technologies.”
KLA Corp. Competitive Advantages
Investors should be aware that KLA Corp. distinguishes itself from its peers with its leading market share in a number of segments within the semiconductor metrology and inspection industry. The Company holds dominance with nearly a 70% market shares in patterned wafer inspection segment. It holds a 65% market share in the overlay subsector of the lithography segment and a 65% share in the defect review subsector. The recent announcement by Taiwan Semiconductor Manufacturing (NYSE:TSM) to boost capex to $100 billion to ensure ample supply of chips in the future, makes KLAC Corp a direct beneficiary especially with 5 nanometer and 3 nanometer wafers.

KLAC Opportunistic Pullback Levels
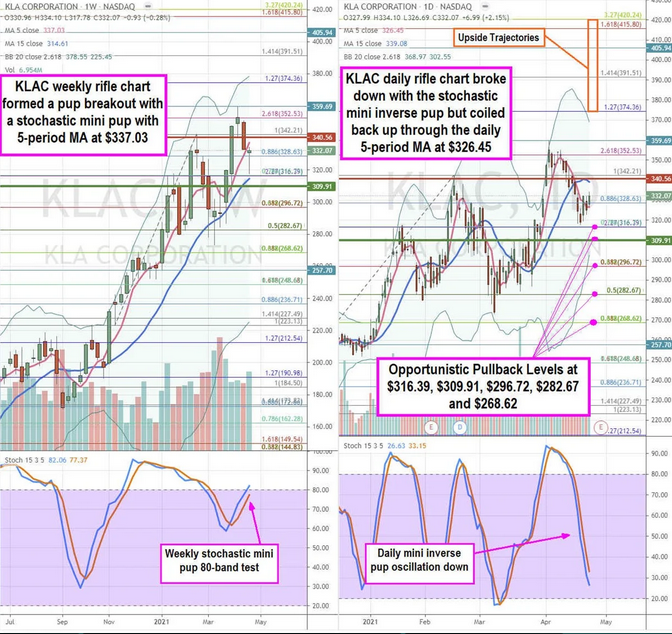
Using the rifle charts on the weekly and daily time frames provides a near-term view of the playing field for KLAC shares. The weekly rifle chart has been in a pup breakout powered by the weekly stochastic mini pup, with a rising 5-period moving average (MA) at $337.03. Shares have fallen below the weekly 5-period MA, which makes the stochastic dormant until the daily stochastic crosses back up. The weekly formed a market structure low (MSL) buy trigger above $309.91, which triggered the weekly pup breakouts. The daily rifle chart peaked out around the $352.53 Fibonacci (fib) level. The daily stochastic formed a mini inverse pup breakdown on the market structure high (MSH) sell trigger at $340.56. After the initial panic selling down to $317.78, shares are trying to base above the daily 5-period MA at $326.45. This requires the daily stochastic to complete its oscillation down and cross back up. Prudent investors can monitor for opportunistic pullback levels at the $316.39 fib, $309.91 weekly MSL trigger, $296.72 fib, $282.67 fib, and the $268.62 fib. The upside trajectories range from the $155.42 fib up towards the $182.84 fib level. Keep an eye on peers AMAT and Lam Research (NASDAQ:LRCX) stocks as they tend to move together.
