
Kemper Corporation (NYSE:KMPR) reported second-quarter 2016 net operating income of 9 cents per share. The Zacks Consensus Estimate was of a loss of 10 cents per share. However, the bottom line plunged 30.8% year over year.
Excluding extraordinary items, net income was 8 cents per share. The company had posted net income of 57 cents per share in the second quarter of 2015. The deterioration was primarily attributable to higher catastrophe losses and underperformance of Alliance United (acquired by the company). Nonetheless, the downside was partially offset by deferred profit reserve adjustment.
Total revenue inched up 3% year over year to $627.2 million due to higher premiums earned in the Property and Casualty segment. The top line also beat the Zacks Consensus Estimate of $609 million by 2.9%.
Total earned premiums increased 10.7% to $553.7 million in the second quarter of 2016.
Net investment income dipped 3.9% to $73.7 million due to weak performance of the alternative investments portfolio. Net realized gains on Sales of Investments plunged 83.5% year over year to $5.6 million.
Total expenses increased 8.6% to $624.6 million due to higher policyholders’ benefits and incurred losses and loss adjustment expenses as well as insurance expenses.
Segment Update
Property & Casualty Insurance segment reported total revenue of $422.4 million, up 14.8% year on year. Earned premiums rose 15.2% to $402.6 million due to higher Personal Automobile premiums. This segment includes the impact of the performance of Alliance United, which was acquired by Kemper on Apr 30. 2015.
The segment reported net operating loss of $8.9 million, wider than the year-ago loss of $2.6 million, mainly due to catastrophe losses of $31.9 million.
Life & Health Insurance segment’s total revenue dipped 1.3% year over year to $201.8 million. Nonetheless, earned premiums inched up 0.3% to 151.1 million. The segment reported operating income of $16.4 million, up 14.7% year over year. Lower legal expenses at Kemper Home Service Companies led to the improvement in operating income, which was partially offset by lower net investment income.
Financial Update
As of Jun 30, 2016, Kemper held an investment portfolio worth $6.7 billion. This reflects an improvement of 4.5% from year-end 2015. Cash dipped 1.2% to $159.8 million and total assets grew 3.4% to $8.3 billion from the end of 2015. Shareholders’ equity increased 5.7% to $2.1 billion from year-end 2015.
Reported book value per share of $41.17 improved 6.1% in the second quarter from $38.82 at the end of 2015. However, excluding net unrealized gains on fixed maturities, book value per share declined to $34.78 from $35.13 as of Dec 31, 2015.
Share Repurchase and Dividend Update
In the first half of 2016, Kemper returned $28.3 million to shareholders through dividends and share buyback worth $24.5 million and $3.8 million, respectively.
Kemper paid dividends worth $12.3 million in the reported quarter.
On Aug 3, the company’s board of directors declared a quarterly dividend of 24 cents per share, which is payable of Aug 29 to shareholders on record as of Aug 15, 2016.
KEMPER CORP Price, Consensus and EPS Surprise
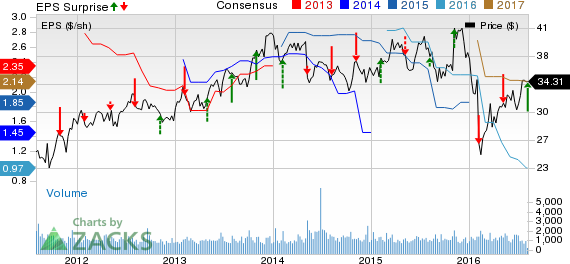
KEMPER CORP Price, Consensus and EPS Surprise | KEMPER CORP Quote
Zacks Rank & Performance of Other Insurers
Currently, Kemper Corporation carries a Zacks Rank #5 (Strong Sell). Among the other players from the insurance industry that have reported their second-quarter results so far, the bottom line at RLI Corp. (NYSE:RLI) and Progressive Corp. (NYSE:PGR) missed their respective Zacks Consensus Estimate, while Brown & Brown Inc.’s (NYSE:BRO) earnings beat the same.
BROWN & BROWN (BRO): Free Stock Analysis Report
RLI CORP (RLI): Free Stock Analysis Report
PROGRESSIVE COR (PGR): Free Stock Analysis Report
KEMPER CORP (KMPR): Free Stock Analysis Report
Original post
Zacks Investment Research