
Kellogg Company (NYSE:K) reported second-quarter 2019 results, with earnings and sales surpassing the Zacks Consensus Estimate. Sales increased on the back of acquisitions as well as broad-based organic growth. Also, the company reiterated its view for 2019.
These upsides boosted investors’ optimism as the stock gained nearly 4% during the pre-market trading session on Aug 1.
Q2 in Detail
Adjusted earnings of 99 cents per share beat the Zacks Consensus Estimate of 91 cents. However, the bottom line fell 13.2% year over year, thanks to higher tax rate, input costs, increased interests and lower returns from pension assets. On a constant-currency (cc) basis, adjusted earnings fell 12.3% to $1.00.
The company delivered net sales of $3,461 million, which rose 3% year over year and surpassed the consensus mark of $3,418 million. The upside can be attributed to gains from the consolidation of Multipro, which offset adverse currency impacts. Sales improved 4.9% to $3,524 million at cc. Further, organic revenues moved up 2.3% to $3,437 million.
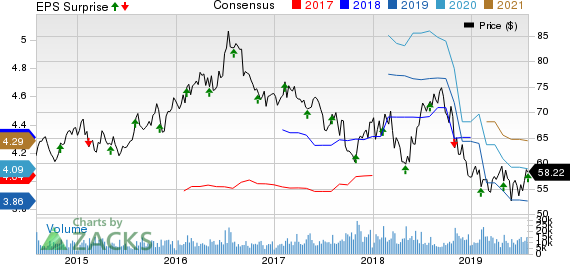
Kellogg Company Price, Consensus and EPS Surprise
The company’s gross profit came in at $1,186 million, down nearly 1.9%. Adjusted gross profit (at cc) fell nearly 2.2% to $1,176 million. Adjusted gross margin at cc was 33.4%, down 240 basis points.
Adjusted operating profit fell almost 5.1% to $452 million, thanks to higher input costs and currency headwinds. The metric slipped 3.8% to $458 million at cc.
Segment Discussion
Sales in the North America segment amounted to $2,148 million, up nearly 1%. Sales fell 1.1% on an organic basis. The region witnessed improvement in snacks and frozen foods while cereals continued to decline. Adjusted operating profit declined 5.9% at cc.
Revenues in the Europe segment totaled $541 million, down 3.2% year on year due to unfavorable currency movements. Nevertheless, organic sales rose 1.8%. The region witnessed growth in Pringles and advancements in Russia. However, cereals in developed markets and wholesome snacks declined. Adjusted operating profit improved 1.7% at cc.
Revenues in the Latin America totaled $239 million, up 0.2% year on year. Growth in underlying business was primarily countered by adverse currency movements. Organic sales jumped approximately 2.3%. The region witnessed growth in cereals and snacks. Adjusted operating profit fell 4.5% at cc, due to higher input costs and investments.
Revenues in the Asia, Middle East & Africa segment totaled $533 million, up 22.6% year over year. The upside can be attributed to Multipro’s consolidation. Organic sales improved 8.5%, backed by higher price realization, expansions by Multipro and growth in Pringles across most regions. Adjusted operating profit improved 27.1% at cc.
Other Financials
Kellogg ended the quarter with cash and cash equivalents of $340 million, long-term debt of $8,262 million and total equity of $3,212 million.
Year to date, the company generated cash from operating activities of $520 million.
2019 Outlook
Management is impressed with the growth witnessed in the second quarter, which was backed by innovation gains, improved performance of snacks brands, higher price realization and expansion in the emerging market regions. Further, the company is on track with inducing greater agility and cost efficiency. Also, management highlighted that it has better visibility regarding performance in 2019 as it has completed the previously-announced divestiture of certain snacks, cookies, crusts and ice cream businesses
That said, Kellogg reinstated its guidance for 2019. Accordingly, sales in 2019 are expected to grow 1-2% at cc and on an organic basis. Further, adjusted operating profit (at cc) is expected to decline 4-5%. Consequently, Kellogg envisions adjusted earnings to drop 10-11% (at cc).

Price Performance
This Zacks Rank #3 (Hold) stock has inched up 1.5% in the past three months compared with the industry’s rise of 4%.
Looking for More Consumer Staples Stocks? Check These
The J. M. Smucker Company (NYSE:SJM) , with a Zacks Rank #2 (Buy), has long-term earnings growth rate of 4%. You can see the complete list of today’s Zacks #1 Rank (Strong Buy) stocks here..
Campbell Soup Company (NYSE:CPB) , with a Zacks Rank #2, has long-term earnings growth rate of 5%.
General Mills, Inc (NYSE:GIS) , with an expected long-term earnings growth rate of 7%, also carries a Zacks Rank #2.
Looking for Stocks with Skyrocketing Upside?
Zacks has just released a Special Report on the booming investment opportunities of legal marijuana.
Ignited by new referendums and legislation, this industry is expected to blast from an already robust $6.7 billion to $20.2 billion in 2021. Early investors stand to make a killing, but you have to be ready to act and know just where to look.
See the pot trades we're targeting>>
Campbell Soup Company (CPB): Free Stock Analysis Report
General Mills, Inc. (GIS): Free Stock Analysis Report
Kellogg Company (K): Free Stock Analysis Report
The J. M. Smucker Company (SJM): Free Stock Analysis Report
Original post