
Mainstream financial media is tripping all over itself about “the stock market’s terrible breadth and why the stock market will crash”. Because hey, bad news sells like hot cakes.
*A lot of traders have an obsession with breadth. The reality is simple: with dozens of breadth indicators, there will always be one that screams bearish.
As we’ve demonstrated before, the NYSE’s breadth is “terrible” because:
- Many of the issues on the NYSE that are making 52 week lows are BONDS (because interest rates are rising).
- Of the stocks that are falling, many of these are FOREIGN (i.e. non American stocks).
- The NYSE increasingly does not reflect “the U.S. stock market” because it is weighed down by foreign stocks. Over the past 10-15 years, more and more non-American stocks are listing on the NYSE.
Hence, using the NYSE’s breadth to talk about the U.S. stock market (i.e. S&P 500) is increasingly a comparison of apples vs. oranges. The NYSE no longer reflects the U.S. stock market the way it used to.
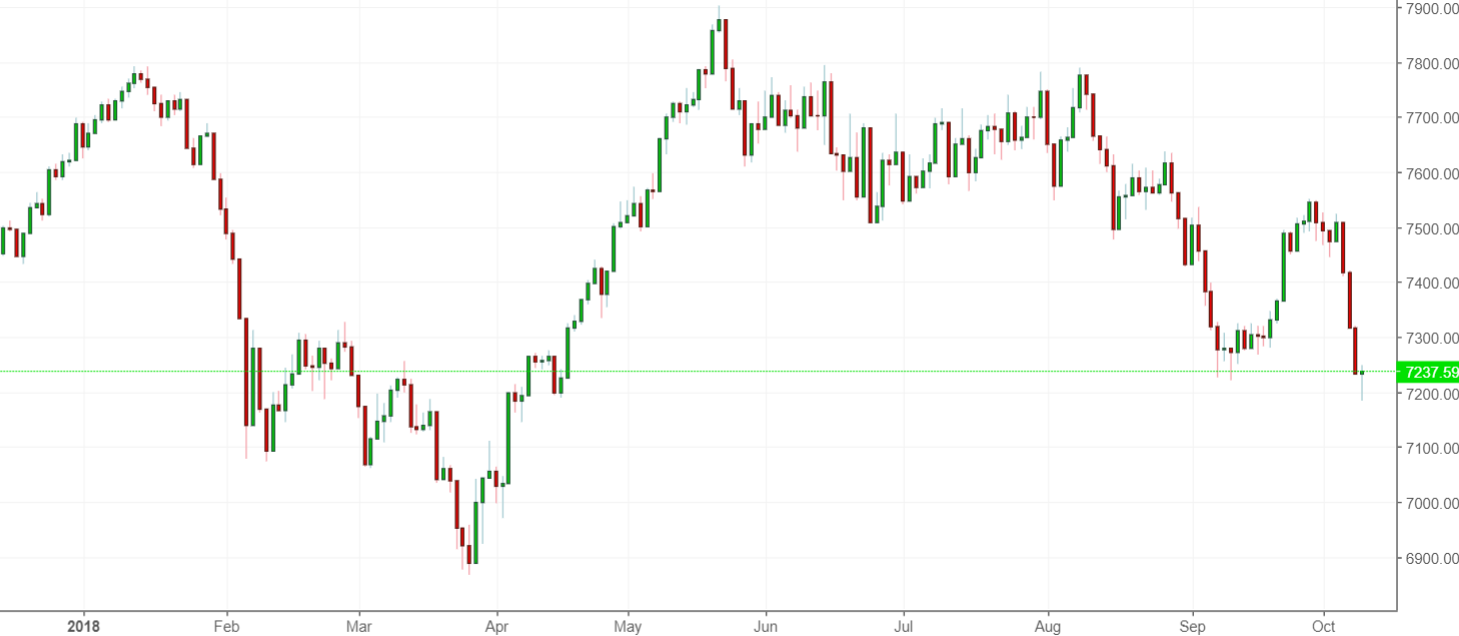
This is clear when you compare the NYSE Composite Index vs. the S&P 500.
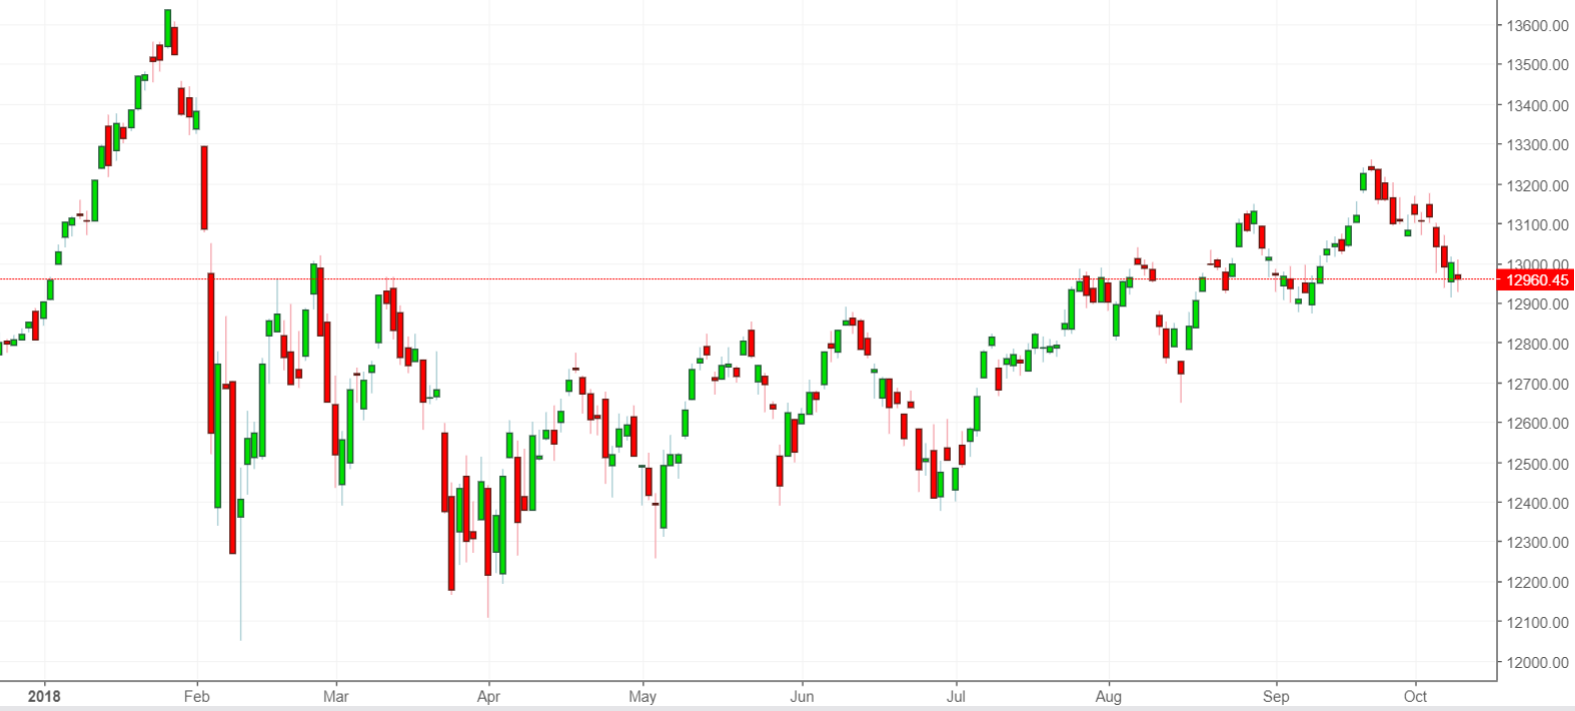
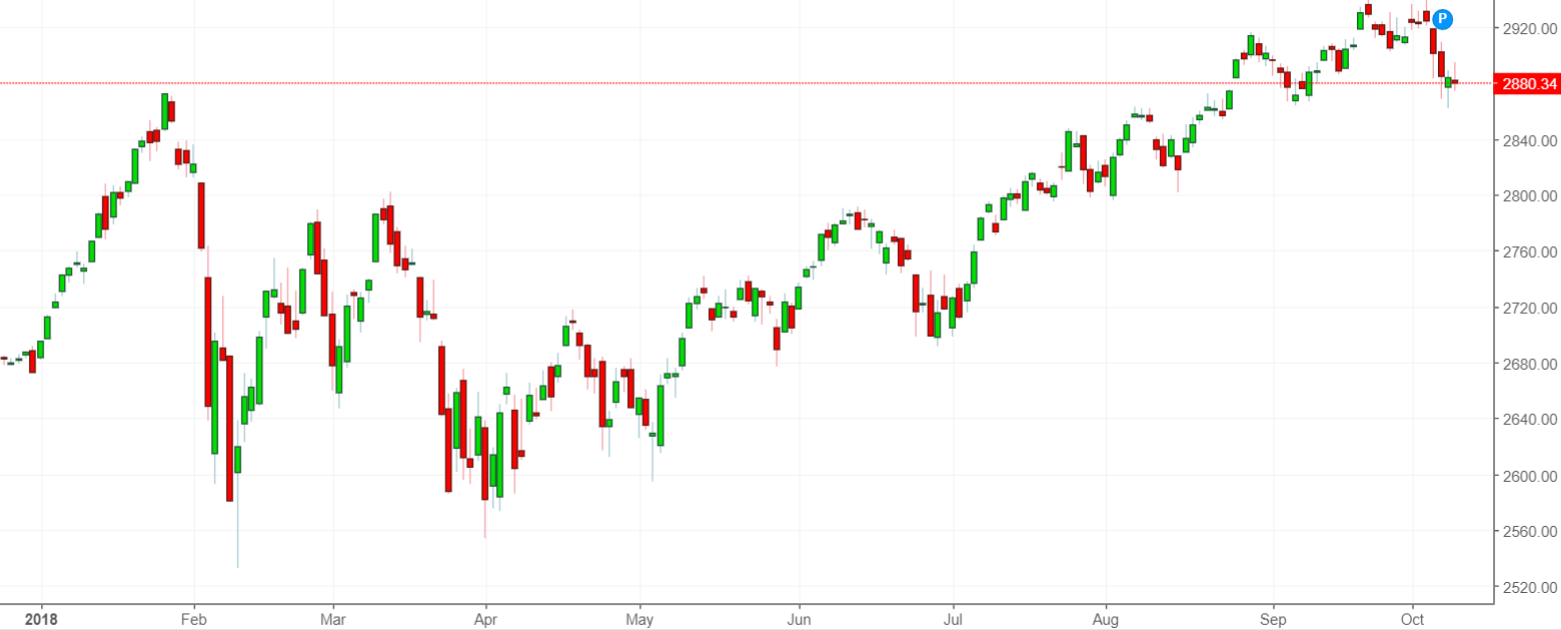
As you can see, the NYSE’s breadth is “terrible” because it doesn’t reflect the U.S. stock market. It reflects the NYSE Composite, which has a lot of foreign factors in it. Foreign stocks have been annihilated by Trump’s trade war this year and their own economic weakness.
Here’s the Chinese stock market.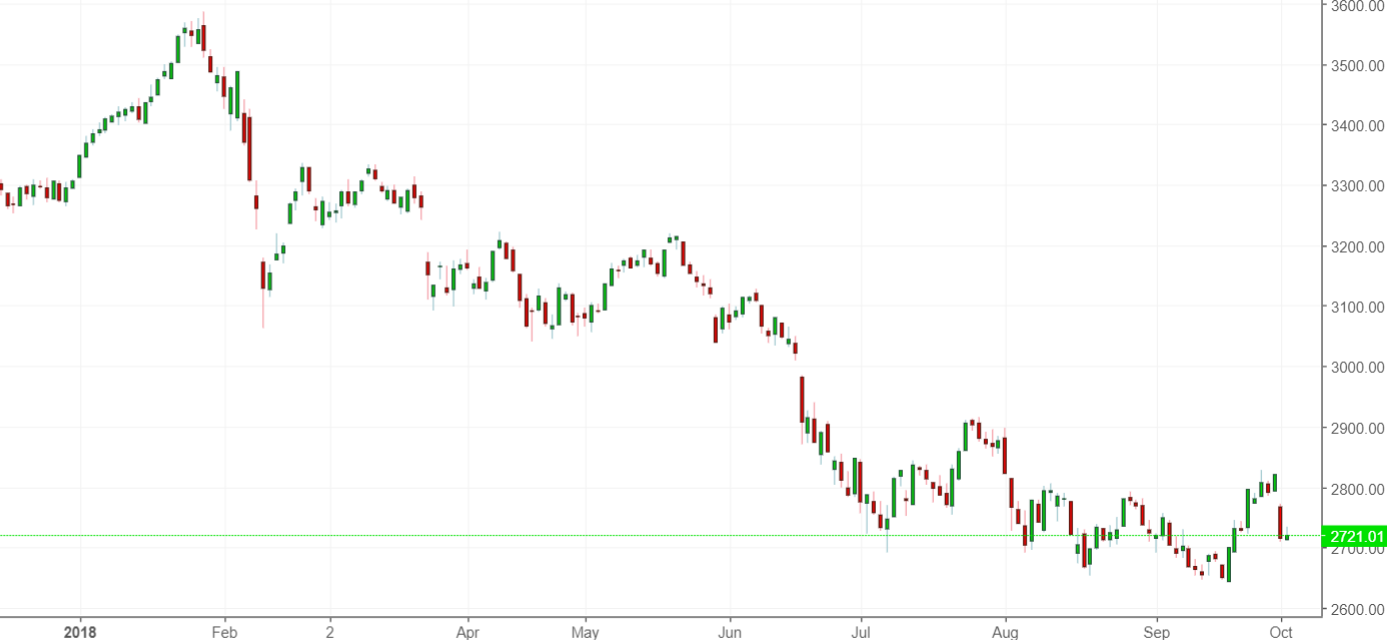
Here’s the German stock market.
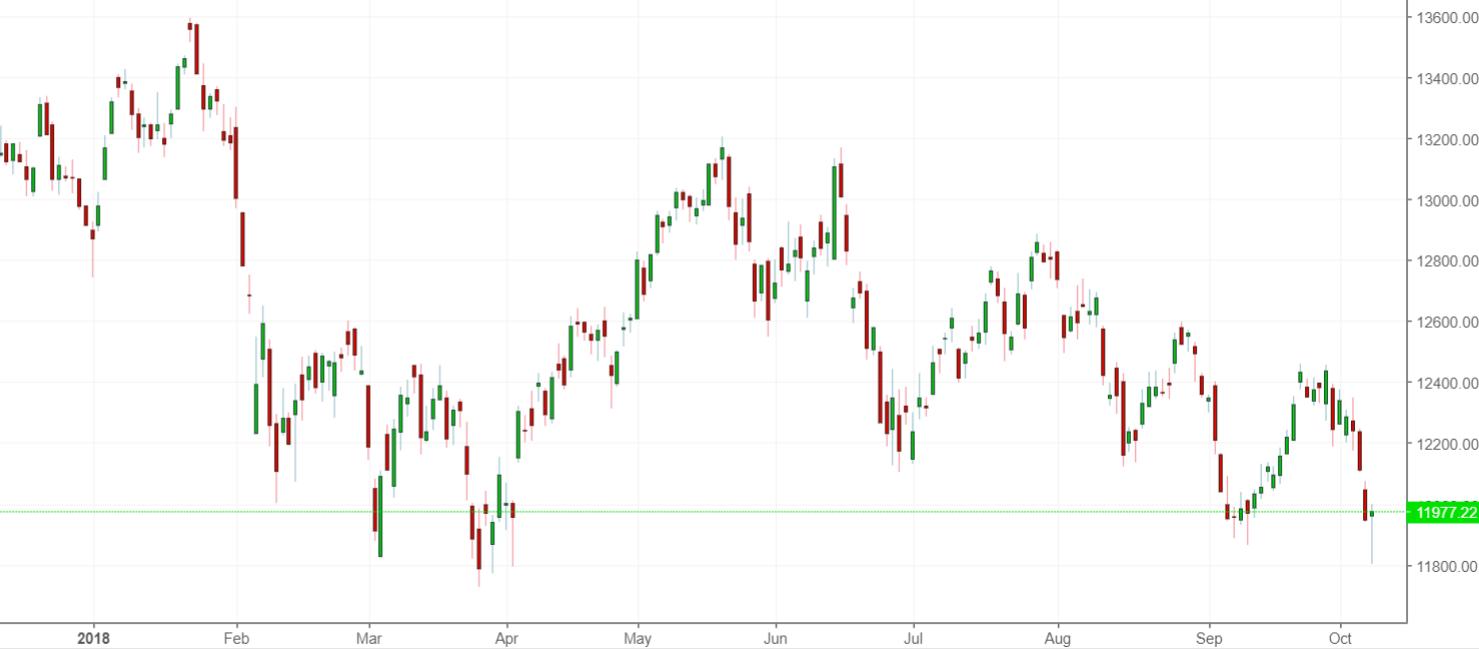
Here’s the UK’s stock market.
How bearish is the divergence between the NYSE and S&P 500?
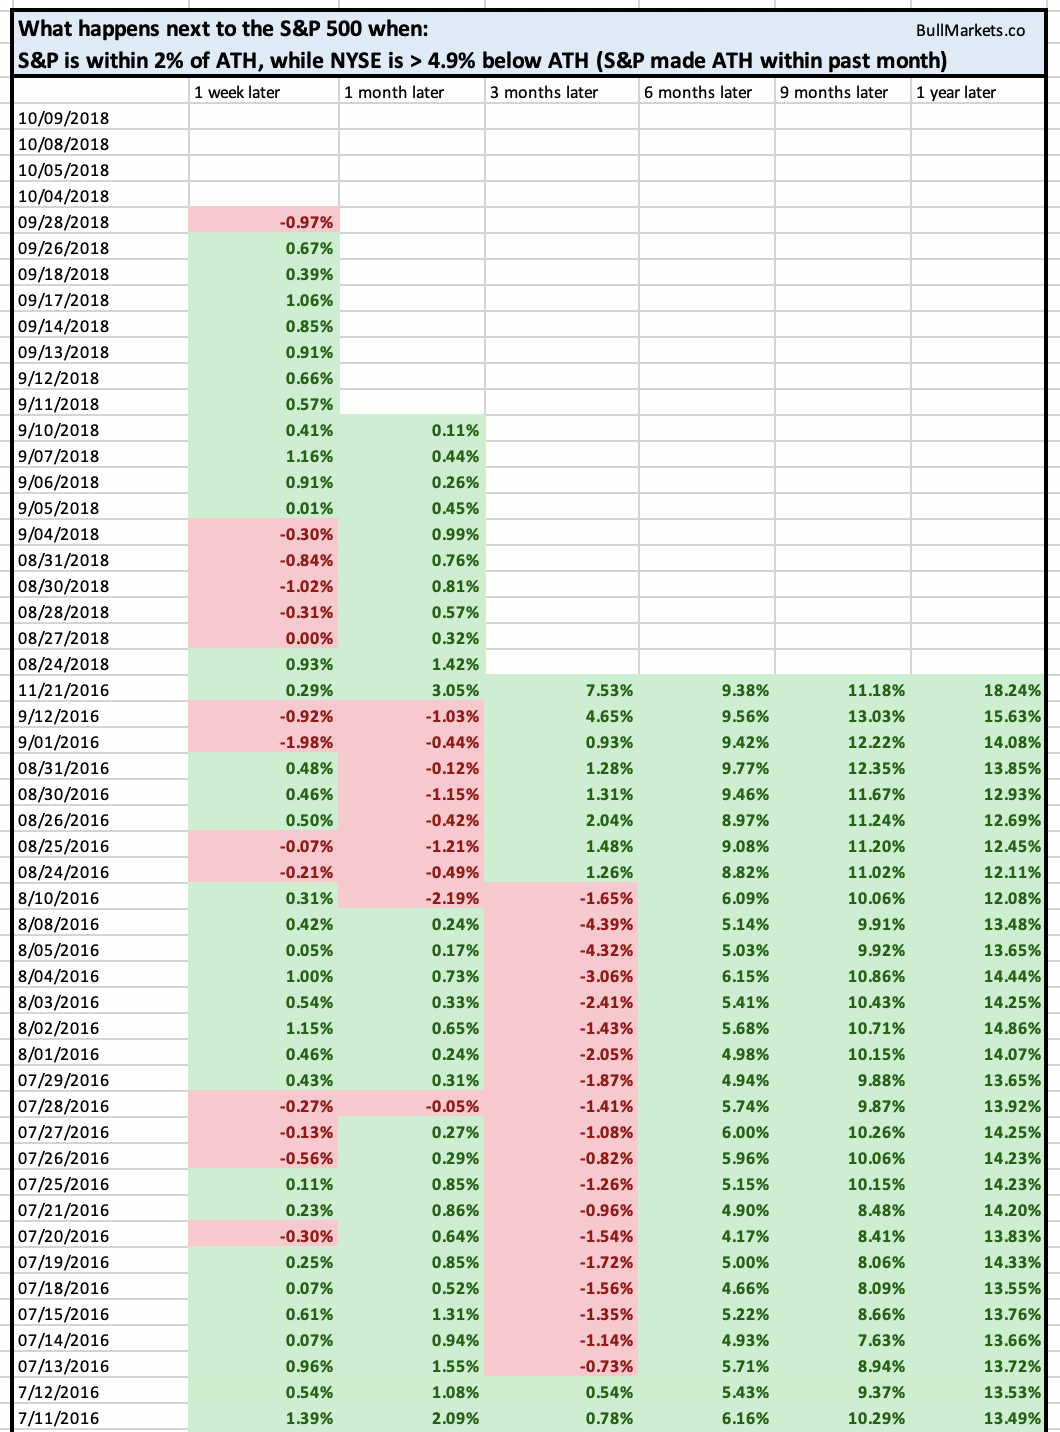
As of right now, the S&P 500 is within 2% of its all-time-high, while the NYSE Composite is more than 4.9% below its all-time high.
How bearish is this divergence?
From 1970 – present, this has happened on 157 days!
- 6 months later, 99% of these historical cases saw the stock market go up.
- 9 months later, 100% of these historical cases saw the stock market go up.
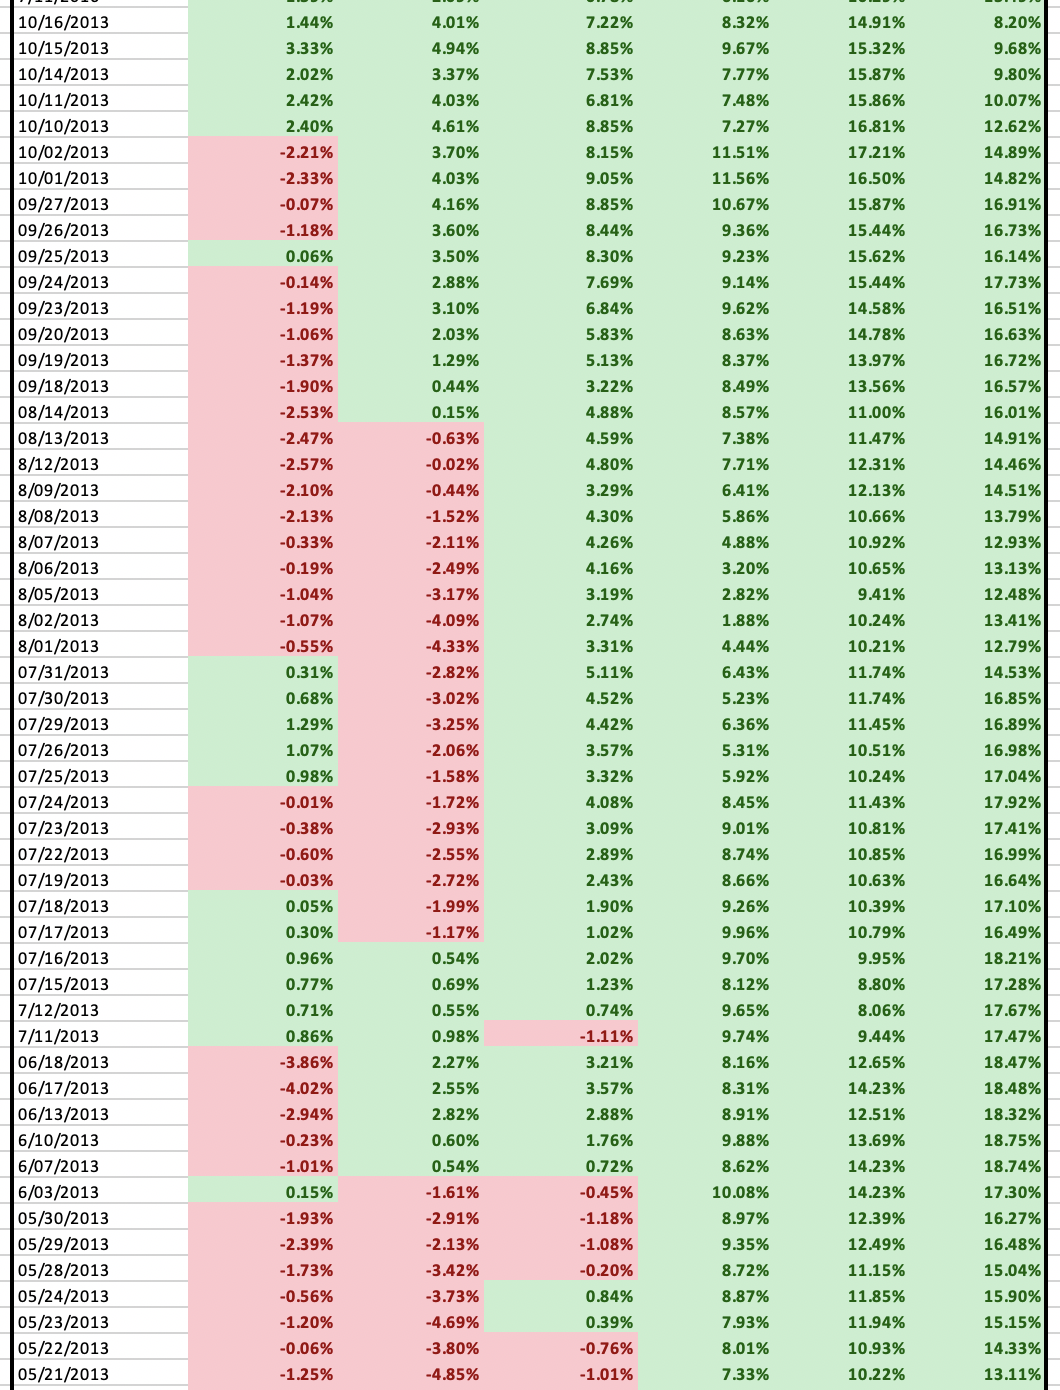
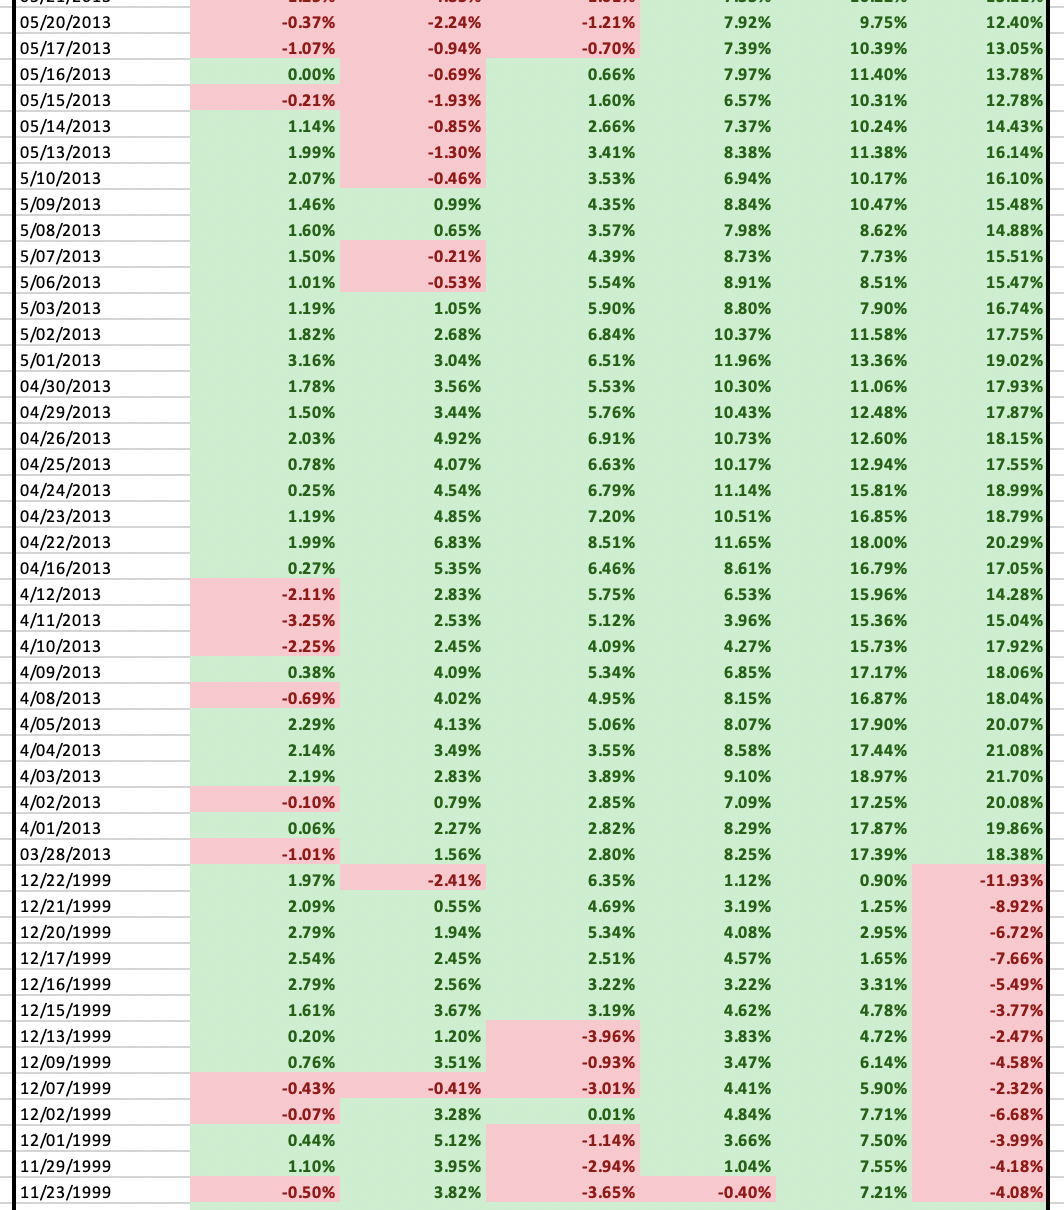
Here are the historical cases.
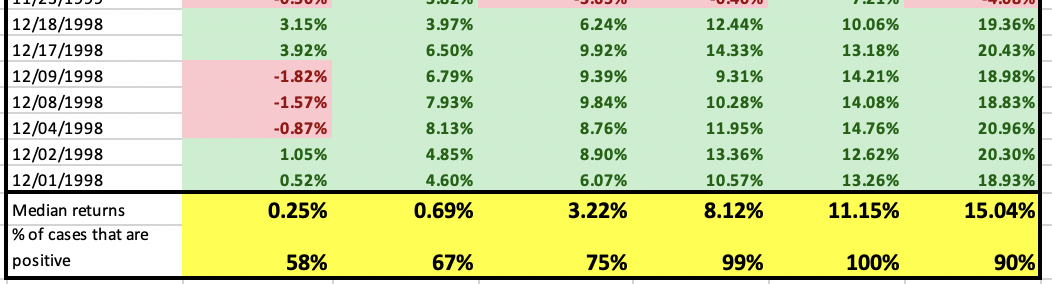
Conclusion
This study speaks for itself. 157 historical cases. ALL bullish 9 months later.
As you can see, these NYSE vs. S&P divergences cluster around:
- Late 1998 – 1999
- 2013
- 2016
- 2018
All of these divergences have occurred after the 1990s, and are becoming increasingly common nowadays. This is because the NYSE increasingly does not reflect the U.S. stock market (the way the S&P 500 does).
Still worried about “bearish breadth”? This is not yet a long term concern for the stock market.
Click here for more market studies