Get 40% Off
👀 👁 🧿 All eyes on Biogen, up +4,56% after posting earnings. Our AI picked it in March 2024.
Which stocks will surge next?
Unlock AI-picked Stocks

JPM Elliott Wave Bullish Structure

Published 07/20/2017, 07:08 AM
Updated 03/09/2019, 08:30 AM

The Elliott Wave view for JPMorgan Chase (NYSE: NYSE:JPM) suggests the rally from February 2016 low (52.5) to 03/01/2017 peak (93.98) have ended wave (3). The pullback from there unfolded as zigzag ABC structure which ended wave (4) at 06/01/2017 low (81.79). Up from there, the stock rallied in another zigzag structure before ending that short term cycle after reaching extreme on 07/06/2017 peak (94.51).

Therefore, JPM made new all time highs and it’s now showing 5 waves from 2016 low and still looking to reach the minimum target at $100.5. The stock can either rally from current levels as it already did 3 waves pullback and reached short term equal legs area 90.9 – 89.39, or the correction can still extend further toward the 50 – 76.4 Fibonacci retracement before finding buyers again to rally to new highs or bounce in 3 waves at least.
However if JPM fails to make new highs and the pivot at June low gives up, then the stock could be still in wave (4) doing an Irregular Flat correction which can take it toward 82-97 area before being able to resume the rally.

JPM 4H Chart 07/20/2017
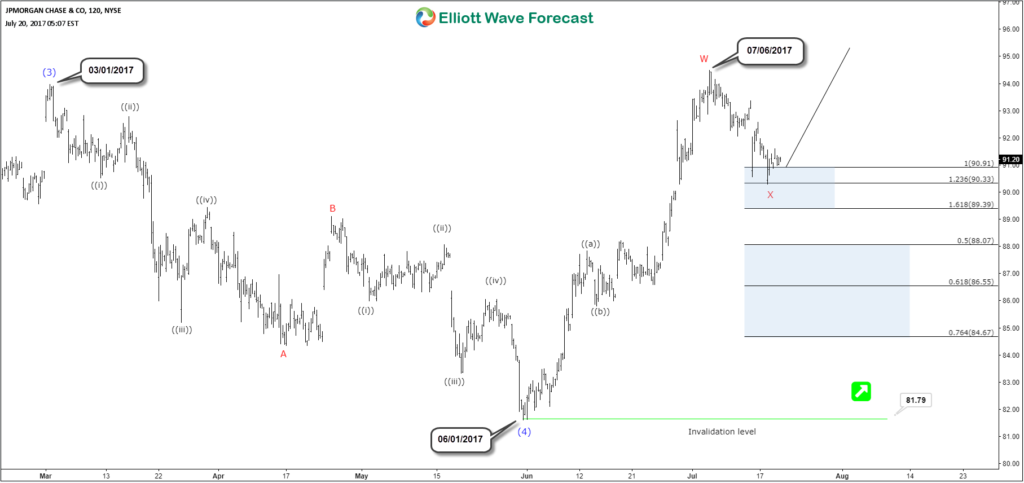
JPM Elliott Wave Bullish Structure 4-Hour Chart

The market conditions have changed over time, so instruments can now be trending higher or lower in series of 3 wave sequences rather than impulsive sequence and this can be frequently seen in the forex market. No one is perfect and we don’t claim to have 100% accuracy, but a system with high accuracy acts as a great trading tool because forecasting is a process of continuous adjustments. A waver (trader) needs to accept when an idea doesn’t work out and adjust to new data.

3rd party Ad. Not an offer or recommendation by Investing.com. See disclosure here or remove ads .

Latest comments

Risk Disclosure: Trading in financial instruments and/or cryptocurrencies involves high risks including the risk of losing some, or all, of your investment amount, and may not be suitable for all investors. Prices of cryptocurrencies are extremely volatile and may be affected by external factors such as financial, regulatory or political events. Trading on margin increases the financial risks.
Before deciding to trade in financial instrument or cryptocurrencies you should be fully informed of the risks and costs associated with trading the financial markets, carefully consider your investment objectives, level of experience, and risk appetite, and seek professional advice where needed.
Fusion Media would like to remind you that the data contained in this website is not necessarily real-time nor accurate. The data and prices on the website are not necessarily provided by any market or exchange, but may be provided by market makers, and so prices may not be accurate and may differ from the actual price at any given market, meaning prices are indicative and not appropriate for trading purposes. Fusion Media and any provider of the data contained in this website will not accept liability for any loss or damage as a result of your trading, or your reliance on the information contained within this website.
It is prohibited to use, store, reproduce, display, modify, transmit or distribute the data contained in this website without the explicit prior written permission of Fusion Media and/or the data provider. All intellectual property rights are reserved by the providers and/or the exchange providing the data contained in this website.
Fusion Media may be compensated by the advertisers that appear on the website, based on your interaction with the advertisements or advertisers.
© 2007-2024 - Fusion Media Limited. All Rights Reserved.