
Low-cost carrier, JetBlue Airways Corporation’s (NASDAQ:JBLU) third-quarter 2016 earnings (excluding special items) of 58 cents per share missed the Zacks Consensus Estimate of 60 cents.
Total operating revenue inched up 2.6% year over year to $1,732 million and also beat the Zacks Consensus Estimate of $1,718 million. The top line was benefitted by a 17.2% increase in other revenues. Passenger revenues in the quarter under review increased 1.3% year over year to $1,571 million.
Operating Statistics
Capacity, measured in available seat miles, expanded 6.3% year over year. Traffic, measured in revenue passenger miles, grew 7.6% in the third quarter. Load factor (percentage of seats filled by passengers) improved 100 basis points (bps) year over year to 86.3% in the reported quarter as traffic growth outpaced capacity expansion.
Yield per passenger mile fell 5.9% year over year to 13.20 cents in the reported quarter. Passenger revenue per available seat mile (PRASM) declined 4.7% to 11.39 cents. Operating revenue per available seat mile (RASM) decreased 3.5% to 12.55 cents.
This Zacks Rank #3 (Hold) carrier faces tough competition from peers like Spirit Airlines Inc. (NASDAQ:SAVE) , SkyWest Inc. (NASDAQ:SKYW) and Southwest Airlines Co. (NYSE:LUV) . You can see the complete list of today’s Zacks #1 Rank stocks here.
Operating Income and Expenses
In the third quarter, total operating expenses increased 3% year over year. Average fuel cost per gallon, inclusive of fuel taxes, declined 20% to $1.48 per gallon. JetBlue’s operating cost per available seat mile (CASM) decreased 3% in the reported quarter to 9.9 cents. Excluding fuel and profit sharing, the metric inched up 3.1% to 7.53 cents.
Balance Sheet
JetBlue ended the third quarter with cash and cash equivalents of $873 million compared with $318 million at the end of 2015. Total debt, at the end of same quarter, was $1,689 million as against $1,827 million at the end of 2015.
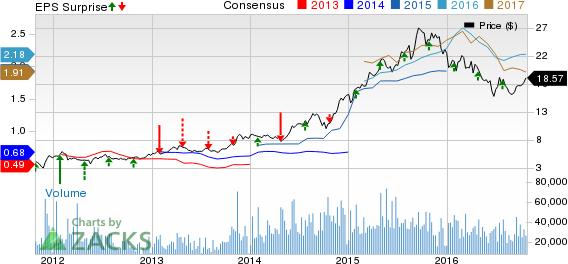
JETBLUE AIRWAYS Price, Consensus and EPS Surprise
Guidance
For the fourth quarter, the carrier expects capacity to increase in the band of 3–5%, including approximately a negative half a point impact from Hurricane Matthew. For full-year 2016, the metric is now expected to increase in the range of 8.5–9% compared with 8–9.5% expected earlier. Consolidated operating cost per available seat mile, excluding fuel and profit sharing, is expected to grow in the band of 4.5–6.5% in the fourth quarter. For 2016, the metric is expected to remain flat to increase 1.5%.
Confidential from Zacks
Beyond this Analyst Blog, would you like to see Zacks' best recommendations that are not available to the public? Our Executive VP, Steve Reitmeister, knows when key trades are about to be triggered and which of our experts has the hottest hand. Click to see them now>>
SOUTHWEST AIR (LUV): Free Stock Analysis Report
JETBLUE AIRWAYS (JBLU): Free Stock Analysis Report
SKYWEST INC (SKYW): Free Stock Analysis Report
SPIRIT AIRLINES (SAVE): Free Stock Analysis Report
Original post
Zacks Investment Research