
- All Instrument Types
- Indices
- Equities
- ETFs
- Funds
- Commodities
- Currencies
- Crypto
- Bonds
- Certificates
Please try another search

IWM Leading Decline

Current Position of the Market
S&P 500: Long-term trend – Bullish, but correcting within the long-term bull market trend.
Intermediate trend– A bearish correction has started which could retrace as low as 2200 before it is complete
Analysis of the short-term trend is done on a daily basis with the help of hourly charts. It is an important adjunct to the analysis of daily and weekly charts which discusses the course of longer market trends.
Market Overview
Market technicians who follow iShares Russell 2000 (NYSE:IWM) are aware of its propensity for reversing its trend ahead of SPX and Dow Jones Industrial Average. This was particularly obvious at the last market top when IWM printed its final high price on 8/31, while SPX did so on 9/21, and DJIA on 10/03.
Last Friday, the major indexes re-tested their lows, but our leading index (IWM) closed the week at a new low. That is a warning that the decline of SPX which is already approaching one hundred points is most likely not over, although a brief bounce could take place before we go lower. The hourly indicators are just beginning to show some positive divergence, but it is not the kind of pattern that normally leads to a significant reversal. More work has to be done in the daily and hourly indicators before they are in a position to forecast an important low. And we are supposed to be in a bullish seasonal period which normally generates a Xmas rally! This year, it is going to come late and turn out to be a New Year’s rally.
All this means that the previous low of 2583 is unlikely to hold, and a new low for wave A (which keeps on being pushed forward and lower) will be made, but once in place,it should be followed by a good countertrend rally.
Chart Analysis (The charts that are shown below are courtesy of QCharts)
SPX daily chart
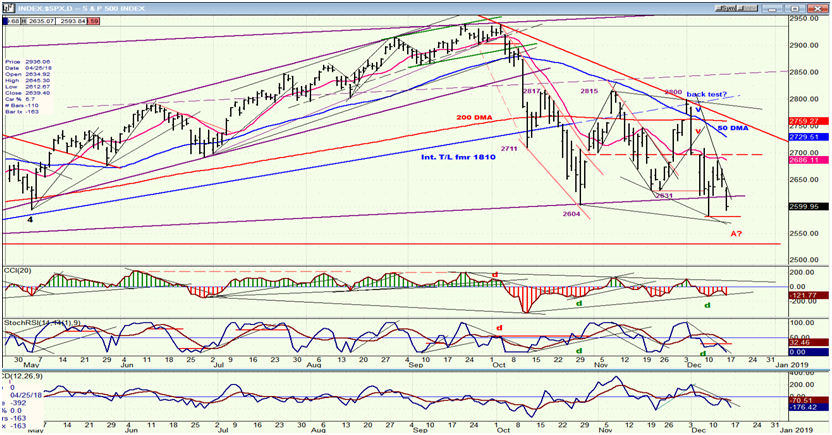
The support level which had held the first two lows of the correction above the purple channel line was weakened on the last short-term decline to 2583; this was an intra-day low and the index did close above the channel line at 2637. However, the ensuing rally met with serious selling and could not even reach 2700 before turning down, and the index is again approaching the last low. This almost ensures a new low for SPX on this move, although 2600 could hold it for a few more hours.
The daily oscillators showed minor divergence at the 2583 low, and this led to the ensuing bounce, but they have all turned down again and the two most sensitive ones have already made new lows while SPX is still above 2583. This is another form of negative divergence which should result in a new low before this move is finished. There are several possible targets for this decline, with the most extreme one just above 2500. Ihave been wondering if we might not have to break below the February low of 2533 to confirm that we have started a bear market before we complete the A-wave.
With the last rally from 2583, I thought that we might have a chance to get back to 2815 one more time, but this may not even be possible for the countertrend rally after we complete wave A. If we get close to 2500 on this decline, even a .618 retracement of the total downtrend from 2941 would not get us there.
SPX hourly chart
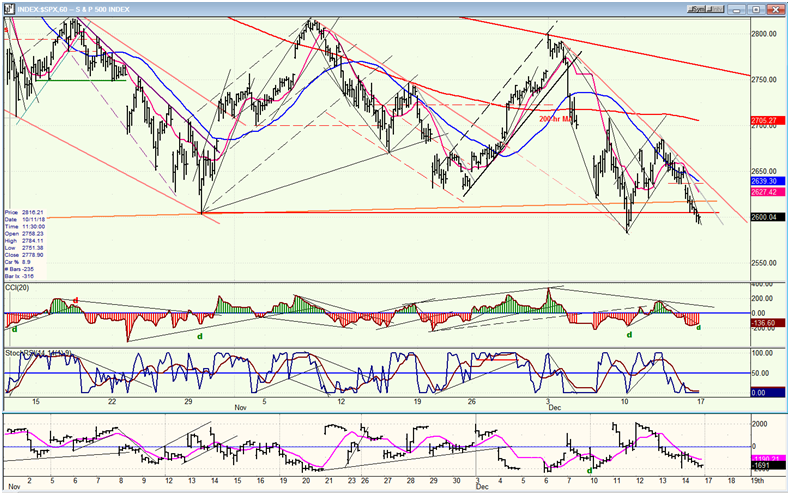
What you see on this chart is not the top of the SPX bull market;the top is off the chart and about 150 points higher. Ever since the initial 337-point decline, the index has moved in a broad sideways pattern (roughly between 2600 and 2800) but lately, it looks as if we are beginning to move out of that range on the downside. Each consecutive top has fallen slightly lower, but since the last decline broke about 20 points lower, and Thursday’s high could not even get halfway to the previous 2800 mark, the recent low of 2683 looks threatened. The bears are gradually gaining control of the intermediate trend and are undoubtedly intent on proving it by making another new low right away.
The move which started at 2685 last Thursday has come down in two phases separated by a downside gap at Friday’s opening. The second phase, which started with that gap, has declined at a steeper angle than the first suggesting that the selling is accelerating. However, the minor positive divergence in the CCI suggests that we may be ready for a bounce in that downtrend before making the final low. The most logical target before we have a good reversal is about 2550, but there are lower P&F counts for the near-term which could be filled, first.
DJIA, SPX, IWM, NDX (daily)
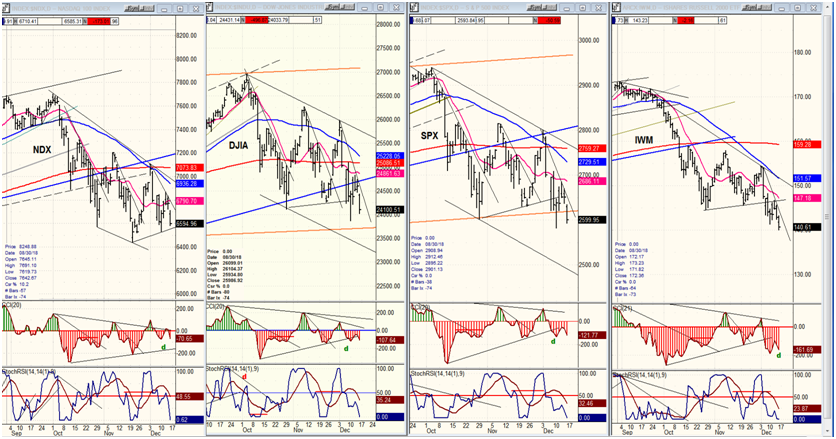
The relative strength position of the four indexes has not changed, but IWM is visibly increasing its weakness over the rest of the market. Last Friday, it made a new low while the others held on to last week’s – for now. By contrast, Nasdaq 100 appears to be doing the opposite: gaining a little, or at least retaining its relative strength of the past two weeks. The weakness in IWM is warning that we may not yet have found a low for this move.
UUP (Dollar ETF)
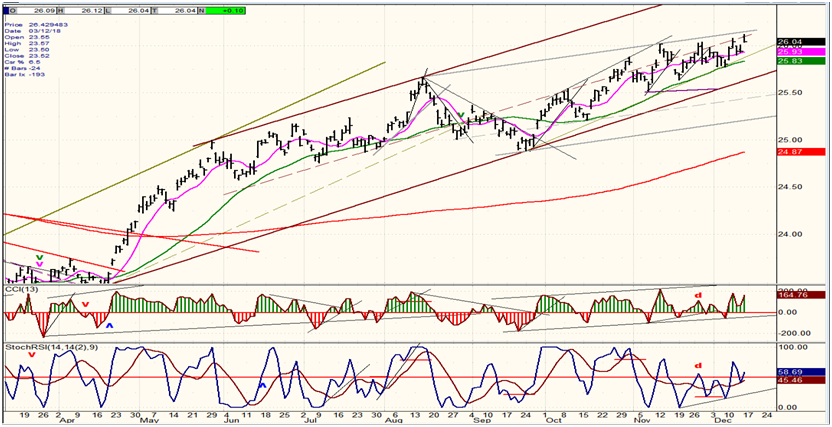
PowerShares DB US Dollar Bullish (NYSE:UUP) is the Energizer bunny. It keeps on going and going! I mentioned before that the green 30-dma acts as a flexible trend line which gives it support every time it is touched. I guess we’ll have to wait until it is broken before a correction can start.
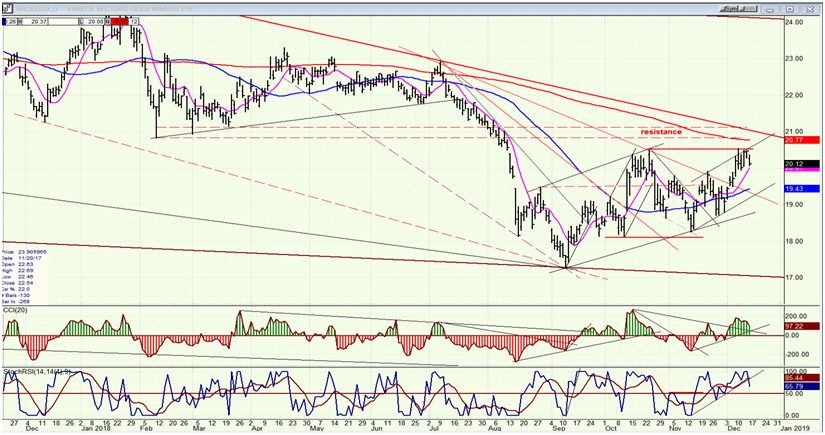
GDX (NYSE:GDX) (Gold miners ETF) daily
GDX has risen to its former short-term high and could surpass it, but it will probably have to wait until there is a good correction in UUP before it can exceed the resistance which lies above.
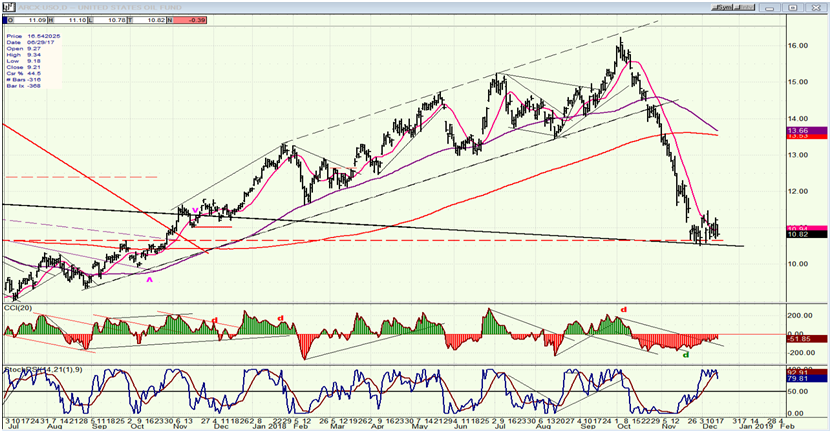
USO (United States Oil Fund (NYSE:USO)) daily
USO found support where it should have and may be starting to build a base. Until it has, not much of an upside rebound can be expected.
Summary
The rally from 2583 was of poor quality and this has led to another decline which is already testing support just above the former low. Although a bounce could take place from Friday’s close, there is a better than even chance that a new low will be made before we can finally complete wave A of the correction.
Related Articles

Bond ETFs have seen record inflows this year. The interest in bond ETFs is spurred by lower interest rates. Investment managers have introduced 120 new bond ETFs this year, 52%...

Every week, we review the big picture of the market's technical condition as seen through the lens of our Big View data charts. Today, I want to focus on 3 key relationships ahead...

If there was a "Stock of the Year" award, it would certainly go to Nvidia (NASDAQ:NVDA). As a result of the continued AI boom, the market cap of this semiconductor manufacturer...
Are you sure you want to block %USER_NAME%?
By doing so, you and %USER_NAME% will not be able to see any of each other's Investing.com's posts.
%USER_NAME% was successfully added to your Block List
Since you’ve just unblocked this person, you must wait 48 hours before renewing the block.
I feel that this comment is:
Thank You!
Your report has been sent to our moderators for review



Add a Comment
We encourage you to use comments to engage with other users, share your perspective and ask questions of authors and each other. However, in order to maintain the high level of discourse we’ve all come to value and expect, please keep the following criteria in mind:
Enrich the conversation, don’t trash it.
Stay focused and on track. Only post material that’s relevant to the topic being discussed.
Be respectful. Even negative opinions can be framed positively and diplomatically. Avoid profanity, slander or personal attacks directed at an author or another user. Racism, sexism and other forms of discrimination will not be tolerated.
Perpetrators of spam or abuse will be deleted from the site and prohibited from future registration at Investing.com’s discretion.