
A BIT OF HISTORY
Earlier this week, the market broke above 2080 on the S&P 500 pushing a breakout above the downtrend line that began last May. That breakout required a slight increase in equity risk allocations.
Not surprisingly, I got a tremendous amount of pushback this past week from individuals with comments like:
“Makes me scared to be a bull when bears throw in the towel.”
I can certainly understand that sentiment. It would certainly seem that way since I have been extremely risk adverse since last May.
Let’s recap the last couple of week’s of commentary to provide some basis for my “bullish metamorphosis.” [Sarcasm Alert]
“In the chart below, you will note that the previous rallies which took the markets to very overbought short-term conditions (top part of the chart). However, those rallies did not reverse the sell-signal in the lower part of the chart. Each of these previous rallies subsequently failed taking stocks lower. This is why the allocation model remained exposed to lower levels of equity risk during this entire period.”

“Currently, as shown above, the short-term dynamics of the market have improved sufficiently enough to trigger an early “buy” signal. This suggests a moderate increase in equity exposure is warranted given a proper opportunity.”
“While allocations have been very conservative since last May, avoiding the ensuing volatile declines last summer and the start of this year, I noted last week the markets had improved technically in the VERY SHORT-TERM which could allow for an increase in equity exposure.“

“While I am on the lookout for an opportunity to modestly increase equity exposure in portfolios given better conditions, I will do so with extreme caution and very close “stop loss” levels. Given the extremely weak underlying fundamentals and NO improvement in the intermediate-term technicals of the market, I do fully expect to be ‘stopped out’ of any additional equity exposure I may add.”
Then this past Tuesday (link above):
“The breakout above the downtrend resistance suggests a moderate increase in equity exposure is warranted. The breakout also suggests that markets will now try to advance back to old highs from last year.
With the breakout of the market yesterday, and given that “short-term buy signals” are in place I began adding exposure back into portfolios. This is probably the most difficult ‘buy’ I can ever remember making.
First, as a recap, it is worth remembering that I have been at 50% or less exposure in portfolios since May of last year. This has allowed my clients to bypass the market turmoil that occurred last summer and at the beginning of this year. As I discuss in the following video (skip to 11:45) being underweight has cost me very little.“
However, now, as we move back into a “seemingly” more bullish set-up, I can begin to increase equity allocations modestly.
Notice, I said modestly. I didn’t say go buy every high-beta thing you can get your hands on.”
WHERE AM I NOW
Let me assure you, I am not a raging “bull” by any stretch of the imagination. The fundamentals simply don’t support prices at current levels particularly as economic and earnings data continue to weaken.
Furthermore, let’s keep my recent actions in perspective. Here was my allocation model previously:

And now:

With 35% weighted in bonds and 35% in cash – I am still very conservatively invested.
If I am wrong, and the market plunges by 10% from current levels, the portfolio would be down less than 1.5% from current levels.
However, if the markets continue to build on the bullish momentum and trigger additional “buy” signals, I can continue to scale in more safely as “confirmation” of a return to the longer-term bullish trend is given.
As shown in the chart below, such a confirmation would currently require:
- A consolidation above 2070
- Some short-term relief of overbought conditions
- A push to new all-time highs.

Importantly, as noted, my stop-losses are currently set at 2000. If I am stopped out of my recent equity risk additions, portfolios will suffer roughly a 3.8% loss in each position. On a weighted basis, each position will contribute a loss of 0.19% each.
I can live with that risk considering that portfolios are still well protected following the declines and turmoil from May of last year.
“Buy why didn’t you buy the low?”
Shut up! You didn’t either. In reality, the majority of investors are now “giving thanks” for getting back to even. It is a hollow victory at best. Furthermore, these same individuals didn’t buy the previous low, or the low before that either.
Hindsight is 20/20, and generally speaking, anyone who runs around proclaiming they were prescient enough to buy the previous lows is probably lying or got lucky on a “guess.” But these are the same individuals you will never hear from again following the realization that “permanent market advances” are not a real thing.
However, from a disciplined investment management process, it was only last week there was sufficient evidence the previous low was indeed a short-term bottom. In fact, with the trend clearly negative, lower highs and lower lows, the correction was in the beginning stages of a full-fledged “bear market” decline. It was only massive Central Bank interventions that stemmed that correction.
Since I manage other people’s retirement and life savings, I am not afforded the luxury of “guessing” at entry points.
I have been managing money, in one form or fashion, for nearly 30-years and have seen investors come and go…but mostly go. This is due simply to the lack of an investment discipline, and emotionally driven mistakes, which eventually shift their money to the hands of those with disciplined, pragmatic and conservative approaches. For my client’s sake, this is the side I choose to be on.
You don’t have to like it. You don’t have to follow it. It is just my approach. Take it or leave it.
But there is one point to be made for my approach – I am still here.
HOPE RUNS HIGH
What’s next?
First, let’s remember that the current advance is not built on improving economic or fundamental data. It is built simply on “hope.”
- Hope the economy will improve in the second half of the year.
- Hope that earnings will improve in the second half of the year.
- Hope that oil prices will trade higher even as supply remains elevated.
- Hope the Fed will not raise interest rates this year.
- Hope that global Central Banks will “keep on keepin’ on.”
- Hope that the US Dollar doesn’t rise
- Hope that interest rates remain low.
- Hope that high-yield credit markets remain stable
I am sure I forgot a few things, but you get the point. With valuations expensive, markets overbought, volatility low, and sentiment pushing back into more extreme territory, there are a lot of things that can go wrong.
While the late week correction has been mild, it has succeeded in working off some of the very short-term overbought condition. Concurrently, the number of stocks trading above their 200-dma has surged along with bullish sentiment.

As shown below, the recent surge in asset prices has also turned the 50-dma sharply higher and is in the position of crossing back above the 200-dma. It is worth noting that the last time this occurred, it did fail shortly thereafter.

I can’t really explain the current rally. All I know is that prices are dictating policy at the moment. We can deny it. We can rail against it. We can call it a conspiracy.
But in the “other” famous words of Bill Clinton: “What is…is.”
The markets are currently betting the economy will begin to accelerate later this year. The “hope” that Central Bank actions will indeed spark inflationary pressures and economic growth is a tall order to fill considering it hasn’t worked anywhere previously. If Central Banks are indeed able to keep asset prices inflated long enough for the fundamentals to catch up with the “fantasy” – it will be a first in recorded human history.
My logic suggests that sooner rather than later somebody will yell “fire” in this very crowded theater. When that will be is anyone’s guess.
In other words, this is all probably a “trap.”
But then again, “hope does spring eternal.”
THE MONDAY MORNING CALL
Analysis For Active Traders
As I stated above, the markets broke out of the current downtrend resistance which has set the markets up for a push to old highs. But, we are also discussing a situation where investment risk is far “outweighed” by the potential for reward.
On Monday and Tuesday, the market broke above the 2080 level and pushed higher. However, the late part of the week saw more “backing and filling” process which has, as noted above, worked off some of the very short-term overbought conditions. This potentially sets the market up for a push to previous highs as we wrap up the month of April.

All of the very short-term signals are improving, but at very high levels. This doesn’t give the market much “fuel” to push substantially higher and caution is warranted.
Steve Burns via SeeItMarket discussed twelve reasons for higher S&P 500 levels from here in the short-term.
- Bullish gap up on Wednesday held support for the rest of the week.
- SPY price is above all key moving averages showing an uptrend.
- The MACD almost has a bullish crossover.
- The Slow Stochastics has a bullish cross and is showing momentum.
- The ATR has begun to decline again. This is bullish
- Good volume on up days in past weeks.
- 78 RSI gives SPY price more room to run before it is overbought. It would be better for the market to go up slowly and build a price base.
- The SPY trend is on track for a 50 day/200 day golden cross in coming weeks.
- We could find key short term support at $207.14, the old resistance level.
- Gap fill danger back to $206.25. Price should find support there if it back fills.
- All time highs are back in play now with this momentum.
- The early plunge and correction in 2016 relieved a lot of selling pressure off the double bottom and the odds are we go higher here.

WARNING: Let me reiterate that this analysis is VERY short-term in nature. Long-term technical and fundamental dynamics suggest a healthy dose of caution and lowered risk exposure in the intermediate term. This is particularly the case as we move into the seasonally weak summer months.
Long-Term Technical and Fundamental Problems
The monthly chart below shows the longer-term technical problems for the market as compared to previous major market peaks.

- The vertical blue dashed lines denote the point where earnings peaked and began to decline.
- As is currently the case, at both previous bull-market peaks the markets traded sideways for roughly 18-months. During that process, as is currently the case, the markets had sharp corrections which recovered back to, or set new, highs.
- Both price momentum and trend indicators are now registering long-term sell signals.
Yes, with interest rates being held at artificially low levels, Central Banks bailing water out of the boat as fast as possible, and an ongoing belief “this time is different,” it is certainly possible markets could move higher in the short-term. However, I have to agree with Jeff Gundlach last week when he stated:
“What you see is that the same pattern has been in place since 2012: Hope for growth in the new year that ends up being revised downwards, over and over and over again. But now we have reached the point at which no one bothers anymore about the comedy of predicting 3% real GDP growth. Even nominal GDP growth isn’t probably going to be at 3% this year. Actually, nominal GDP is at a level that has historically been a recessionary level. It isn’t this time because the inflation rate is close to zero. But no one bothers anymore and the Federal Reserve has basically given up.
The US stock market seems egregiously overvalued versus other stock markets.
It’s remarkable that the US stock market is within about 2% of its all-time high and every other significant stock market is down substantially. Also fundamentally, it’s very hard to believe in US stocks.
Earnings and profit margins are dropping and companies basically are borrowing money to pay dividends and to buy back shares. That’s completely non-productive borrowing and just creates a bigger debt burden. So it’s likely that you are going to see declines in the US stock market and since the correlations are so high this means that probably the junk bond market will go back down, too.“
And he is probably going to be right…again.
Increasing The Allocation Model
As I stated last week:
“Okay, so with that said, this week we will be watching for the market to break above its downtrend at 2080 with some level of conviction. As I will review below, the allocation model is already set to increase to 50% equity exposure if this should occur.”
That outcome did occur, and I have increased the allocation model accordingly to new levels.
Again, let me reiterate for the umpteenth time: This is short-term only and I fully expect to get stopped out. In fact, my next article could very well be entitled “How To Short Against The Box And Love It.”
S.A.R.M. Model Allocation
The Sector Allocation Rotation Model (SARM) is an example of a basic well-diversified portfolio. The purpose of the model is to look “under the hood” of a portfolio to see what parts of the engine are driving returns versus detracting from it. From this analysis, we can then determine where to overweight sectors which are leading performance, reduce in areas lagging, and eliminate those areas that are dragging.
Over the last four weeks, not surprisingly, RISK based sectors have continued to improve as the rally has progressed as SAFETY sectors have come under continued pressure.
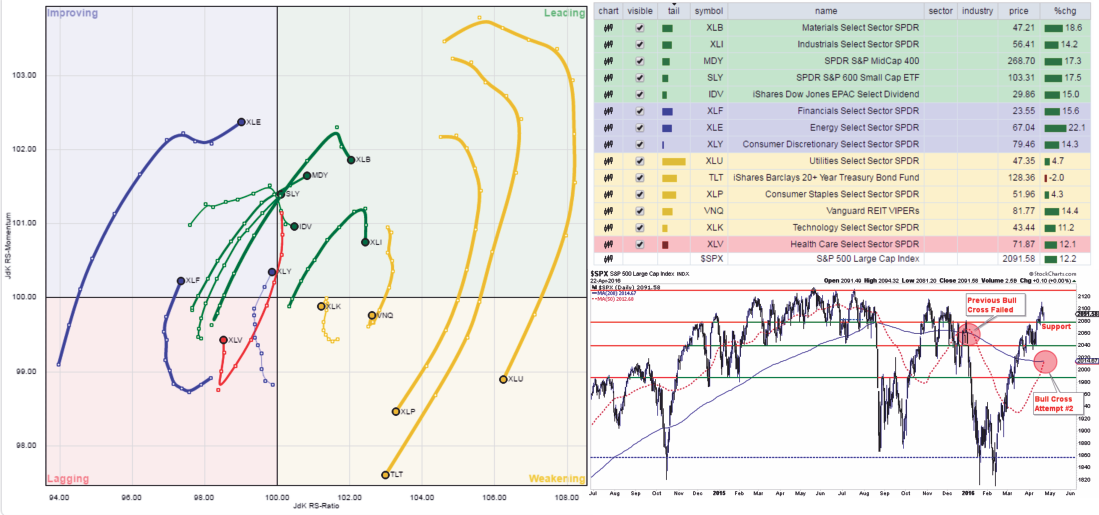
Industrials, Materials), Mid-Cap and International sectors have been leading the charge over the last three weeks due to the decline in the US dollar. This week, Small-Cap stocks have now joined the lead.
Energy and Discretionary have improved but are still lagging the S&P 500 index as a whole. Financial stocks have now improved over the last week from being laggards over the last couple of months.
Important Note: While small and mid-cap stocks have improved during the rally over the last several weeks, price action remains primarily concentrated in large-cap defensive sectors of the market. While the S&P 500 is approaching previous highs, the dividend sectors have gone virtually parabolic. Furthermore, small, mid-cap, international and emerging market stocks still remain in a negative downtrend and have made no progress over the last 16-months.

Not surprisingly, the SAFETY sectors have begun to lag the broader market with Bonds, Staples, Utilities & REIT’s beginning to lag in performance. Some profit taking in these sectors is advisable if you have not done so previously.
Technology is trying to improve in the last week but is still lagging the S&P 500 as a whole while Healthcare companies continue to lag at this point.
A Note On Oil and Energy Stocks
The rally in oil prices, along with the subsequent recovery in Energy stocks is likely close to its end. It is HIGHLY advisable to take profits in speculative positions and/or reduce holdings that have had a recovery in recent weeks.
As shown in the chart below, the extreme oversold condition has been fully reversed into an extreme overbought condition. Currently, both West Texas Intermediate Crude and the New York Stock Exchange Energy Index are trading 2-standard deviations above their long-term, and declining, moving average.

Furthermore, the record net-short positions on oil that existing several months ago during the decline have also been fully reversed into record net-long positions.

With the dollar oversold currently, and a rally expected in the dollar this summer, the downside risk to oil prices back to the low $30/bbl range is extremely prevalent.
As the Steve Miller Band once sang: “Come on, take the money and run.”
We can always buy back again later.
S.A.R.M. Updated Allocation Model
I am updating the S.A.R.M. model to reflect the portfolio allocation changes this week. The increase moves the current model allocation exposure back to 50% of Target Weightings in an equally weighted portfolio.

We continue to watch for improvement in the relative performance of each sector of the model as compared to the S&P 500. The next table compares each position in the model relative to the benchmark over a 1, 4, 12, 24 and 52-week basis. Notice the relative improvement or weakness relative to index over time. For example, notice that sectors like Materials, Financials, Healthcare & Energy are outperforming the S&P 500 over the last week.

The last column is a sector specific “buy/sell” signal which is simply when the short-term weekly moving average has crossed above or below the long-term weekly average.
With the break above downtrend resistance, as discussed above, the model is now adjusted for an increase in equity exposure as follows.

As of this week, the portfolio model now holds CASH to 35%, 35% in bonds, and 30% in equities.
As always, this is just a guide, not a recommendation. It is completely OKAY if your current allocation to cash is different based on your personal risk tolerance, time frames, and goals.
For longer-term investors, we need to see an improvement in the fundamental and economic backdrop to support a resumption of the bullish trend. Currently, there is no evidence of that occurring.