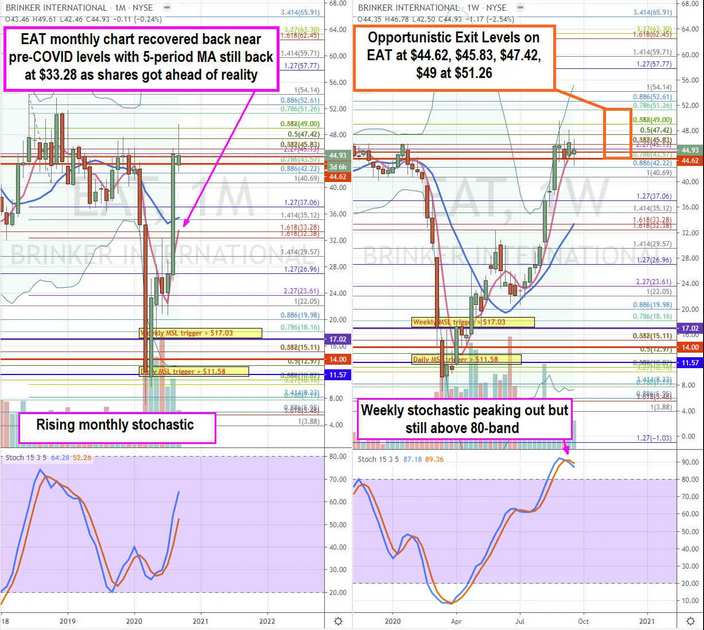
Restaurant operator Brinker International (NYSE:EAT) shares have nearly doubled since our MarketBeat Original article highlighting the delicious entry on pullbacks under the restart narrative on May 20, 2020. With isolation mandates lifted, the restart narrative has taken shape as limited in-dining room business improves sequentially. With shares returning back to pre-COVID levels when dining rooms were operating without capacity restrictions, the stock may have gotten ahead of itself. The Company set the bar and expectations high by raising its forecasts. Prudent investors that took opportunistic pullback entries earlier might consider unwinding some of the position ahead of the next earnings release into opportunistic exit levels ahead of a sell the news reaction.
Q4 FY 2020 Earnings Release
On Aug 12, 2020, Brinker released its fourth-quarter fiscal 2020 results for the quarter ending June 2020. The Company reported an earnings-per-share (EPS) loss of (-$0.88) excluding non-recurring items versus consensus analyst estimates for a loss of (-$1.37), beating estimates by $0.49. Revenues fell (-32.5%) year-over-year (YoY) to $563.20 million falling shy of the $572.92 million consensus analyst estimates.
Conference Call Takeaways
Brinker managed to pay down debt to pre-COVID levels. Chilli’s continued to see sequential sales improvement ended June down (-10.9%) YoY. This is a big improvement from the lows of (-51%) in April at the peak of COVID-19. The Company can and has leveraged its 8-million-member loyalty database for customer trends. New app features like one-touch reorders of guest’ most frequently ordered items have lent to the acceleration of digital sales from low teens to over 50% in Q4 with only a “slight dip” as dining rooms remain open. The Company launched its first virtual brand “It’s Just Wings” in 1,050 Maggiano’s and Chilli’s domestically. Brinker estimates the brand will exceed $150 million in sales in the first year, qualifying it as a top 200 restaurant brand. The Company paid down $220 million in debt and extended it credit revolver by 15-months now maturing in December 2022. The Company ended the quarter with $575 million of liquidity including cash and credit revolver.
Raised but Limited Guidance
Brinker plans to open or relocate four restaurants this year. Due to continued uncertainty for COVID-19, the Company pulled full-year guidance but raised guidance estimates for the next quarter. Brinker raised Q1 fiscal 2021 EPS guidance to a loss of (-$0.40) to (-$0.25) versus consensus analyst estimates for a loss of (-$0.56). The Company expects Q1 comparable same-store-sales (SSS) to be down to the (-10%) to (-15%) range YoY. The biggest obstacle is the being able to get in-restaurant dining capacity back up to the 90% level and having off-premise sales channel offset the remaining volume. On Sept. 26, 2020, the state of Florida pulled all capacity restrictions of restaurants.
Valuation Reality
Fiscal 2019 EPS reached near $4 per-share when shares were trading at the current price levels. After the onset of COVID-19, the fiscal 2020 EPS estimates of $1.16 and fiscal 2021 EPS estimates of $1.40 are nowhere near reality. The Company pulled future full-year EPS guidance and instead provided only Q1 adjust EPS and revenue guidance range. The question is how can the market justify shares of Brinker trading at pre-pandemic levels when current and future business can only hope to recover a fraction of even FY 2019 figures? Morgan Stanley upgraded shares on Aug. 28, 2020, causing a continuation of the short squeeze which peaked at the $49.16 highs. Prudent investors holding nice profits may consider taking some gains into opportunistic exit levels before reality sets in on the next earnings release due out in late October.

EAT Opportunistic Exit Levels
Using the rifle charts on the monthly and weekly time frames provides a broader view of the landscape for EAT stock. The monthly rifle chart triggered a stochastic mini pup on the market structure low (MSL) buy above $26.96. The monthly 5-period moving average (MA) support is at the $33.28 Fibonacci (fib) level. The $47.42 to $49 level may be forming a double top. The Morgan Stanley (NYSE:MS) upgrade propelled shares on the weekly pup breakout surging it to the $49.61 highs before forming a weekly market structure high (MSH) sell trigger under $44.62. As the weekly 5-period MA acts like a “pool tarp” at $45.18, investors should be aware of the weekly stochastic peaking and be proactive in unwinding at into opportunistic exit levels at the $44.62 MSH trigger and fib, $45.83 fib, $47.42 fib, $49 fib and $51.26 gatekeeper fib. Since the shares have spiked so quickly, it’s crucial to keep a downside profit stop if shares fall under the $42.22 fib as weekly channel tightening backdrop the stock towards its weekly 15-period MA at $33.28. Prudent investors should consider selling into a strength rather than waiting for weakness to set in, which is a common mistake.
