
April 20, 2020, will go down in history as a watershed event in the crude oil futures market. Crude oil futures on NYMEX started trading in 1983. In 1986, the price of the nearby futures contract fell to a low of $9.75 per barrel, which stood as the bottom for 34 years. On April 20, the expiring May futures contract declined below the 1986 low, fell through zero, and reached -$40.32 per barrel. The lack of storage caused the price of crude oil for nearby delivery to become a bearish hot potato.
A negative price for one of the world’s most liquid commodities has wide-ranging ramifications for a host of other markets. When it comes to the ETF and ETN products that track the price of crude oil, the assumptions of the past are now questionable. The United States Oil Fund, LP (NYSE:USO) sought to replicate the price action in the nearby NYMEX crude oil futures contract. However, the price action on April 20 changed that because the ETF cannot trade below zero.
June Crude Oil Falls To Single-Digit Price And Recovers
April was a wild month in the crude oil futures market. June NYMEX futures traded in a range from $6.50 to a high of $33.15 over the month or $26.65. From high to low, the continuous futures contact’s range was from -$40.32 to $29.13 or an incredible $69.45. The price of June futures was bumping up against the $20-per-barrel level at the end of last week.
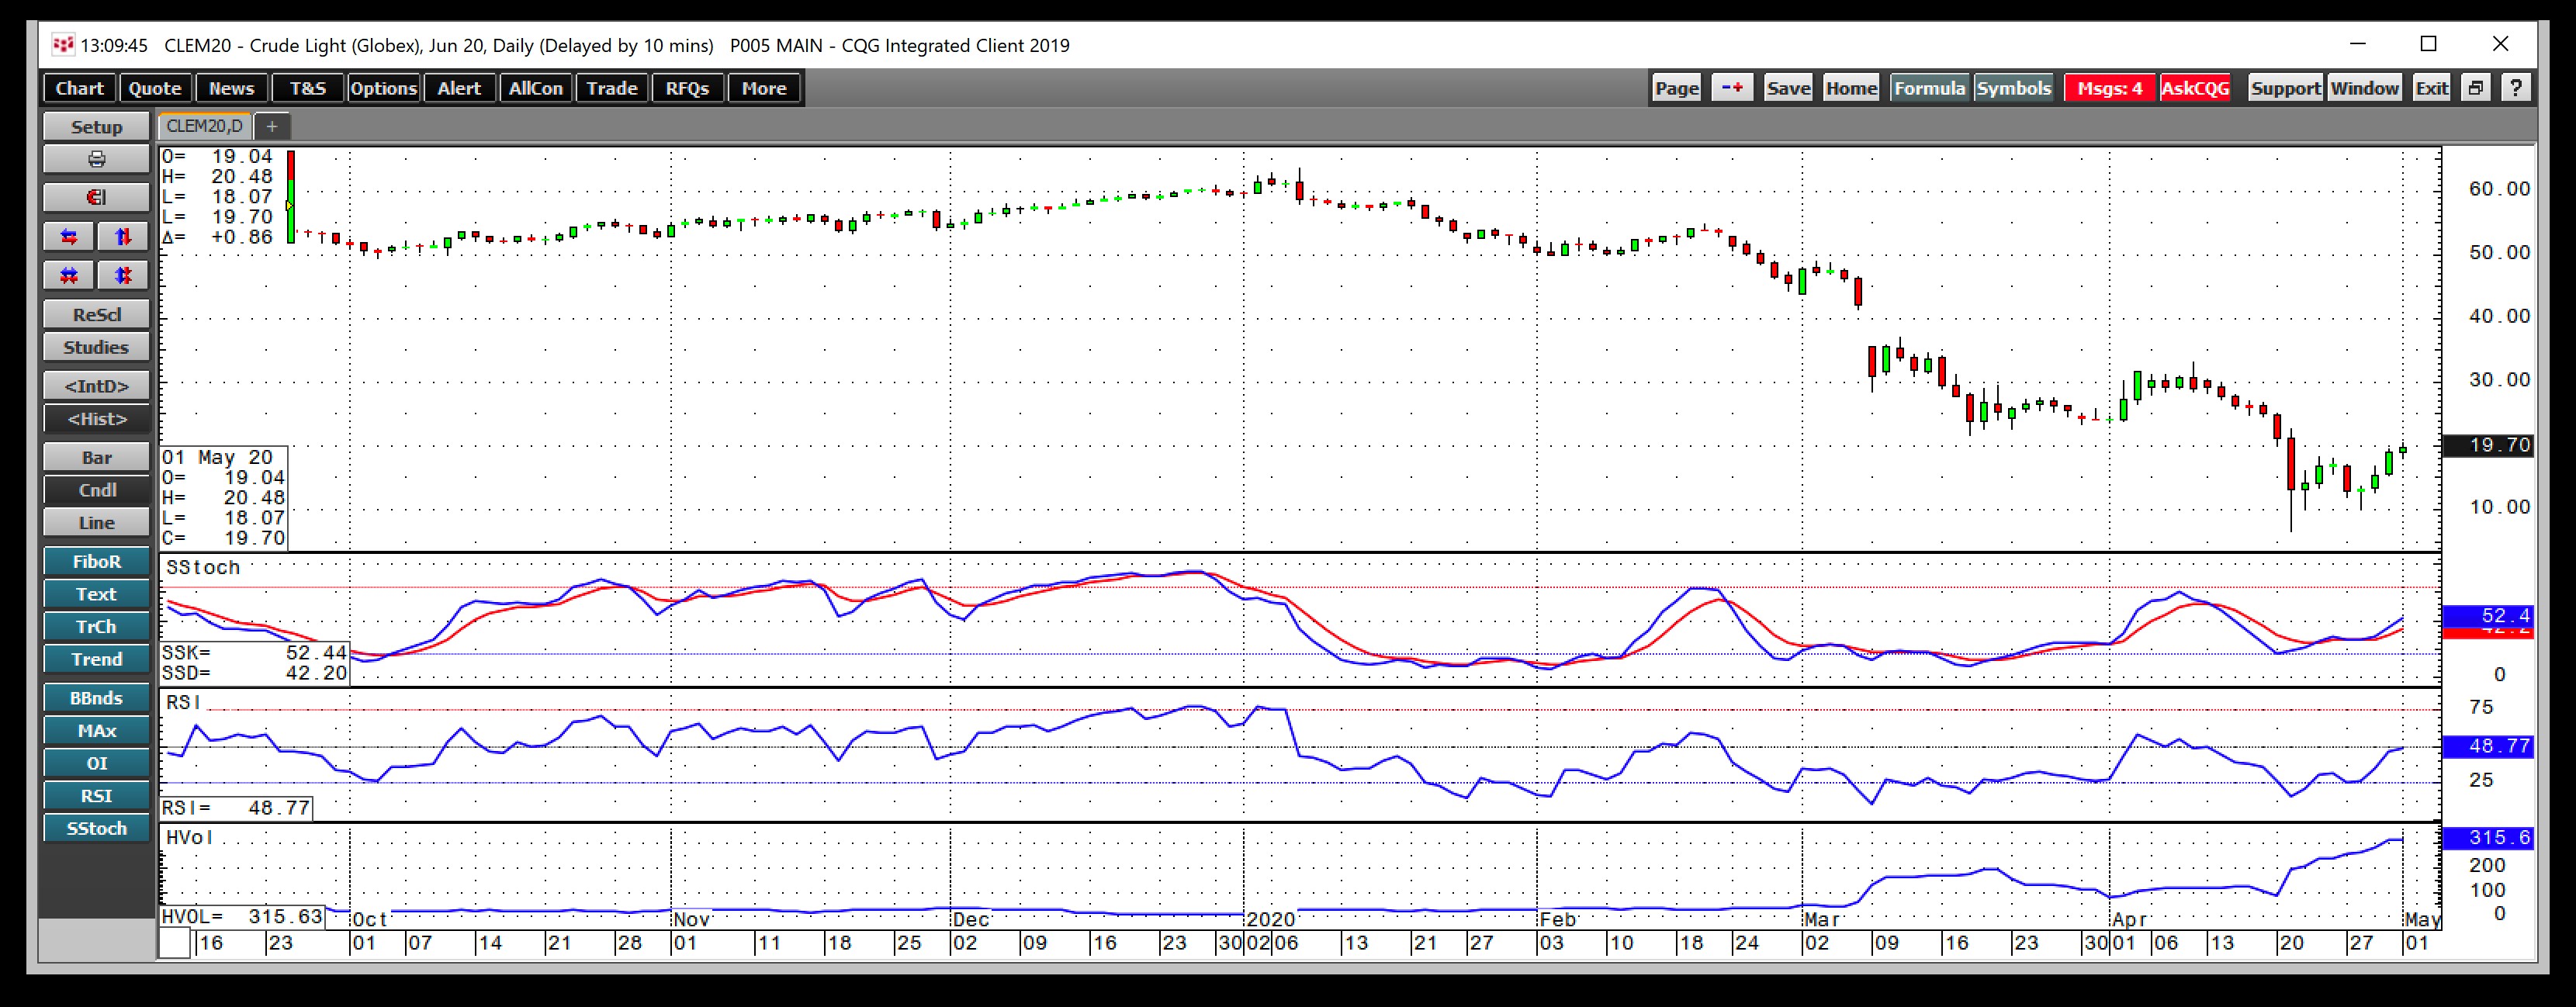
(Source: CQG)
As the daily chart illustrates, the price action has been bullish since April 20. Price momentum and relative strength indicators were at neutral readings on May 1, as the price was flirting with the $20 per barrel level. The June futures traded to a high of $20.48 last Friday.
Daily historical volatility at over 315% reflects the wild trading conditions in the oil futures arena over the past weeks. Crude oil tripled in value from its price on April 20 on May 1.
Open Interest Shrinks, But Oil-Related Stocks Rise
Open interest is the total number of open long and short positions in a futures market.
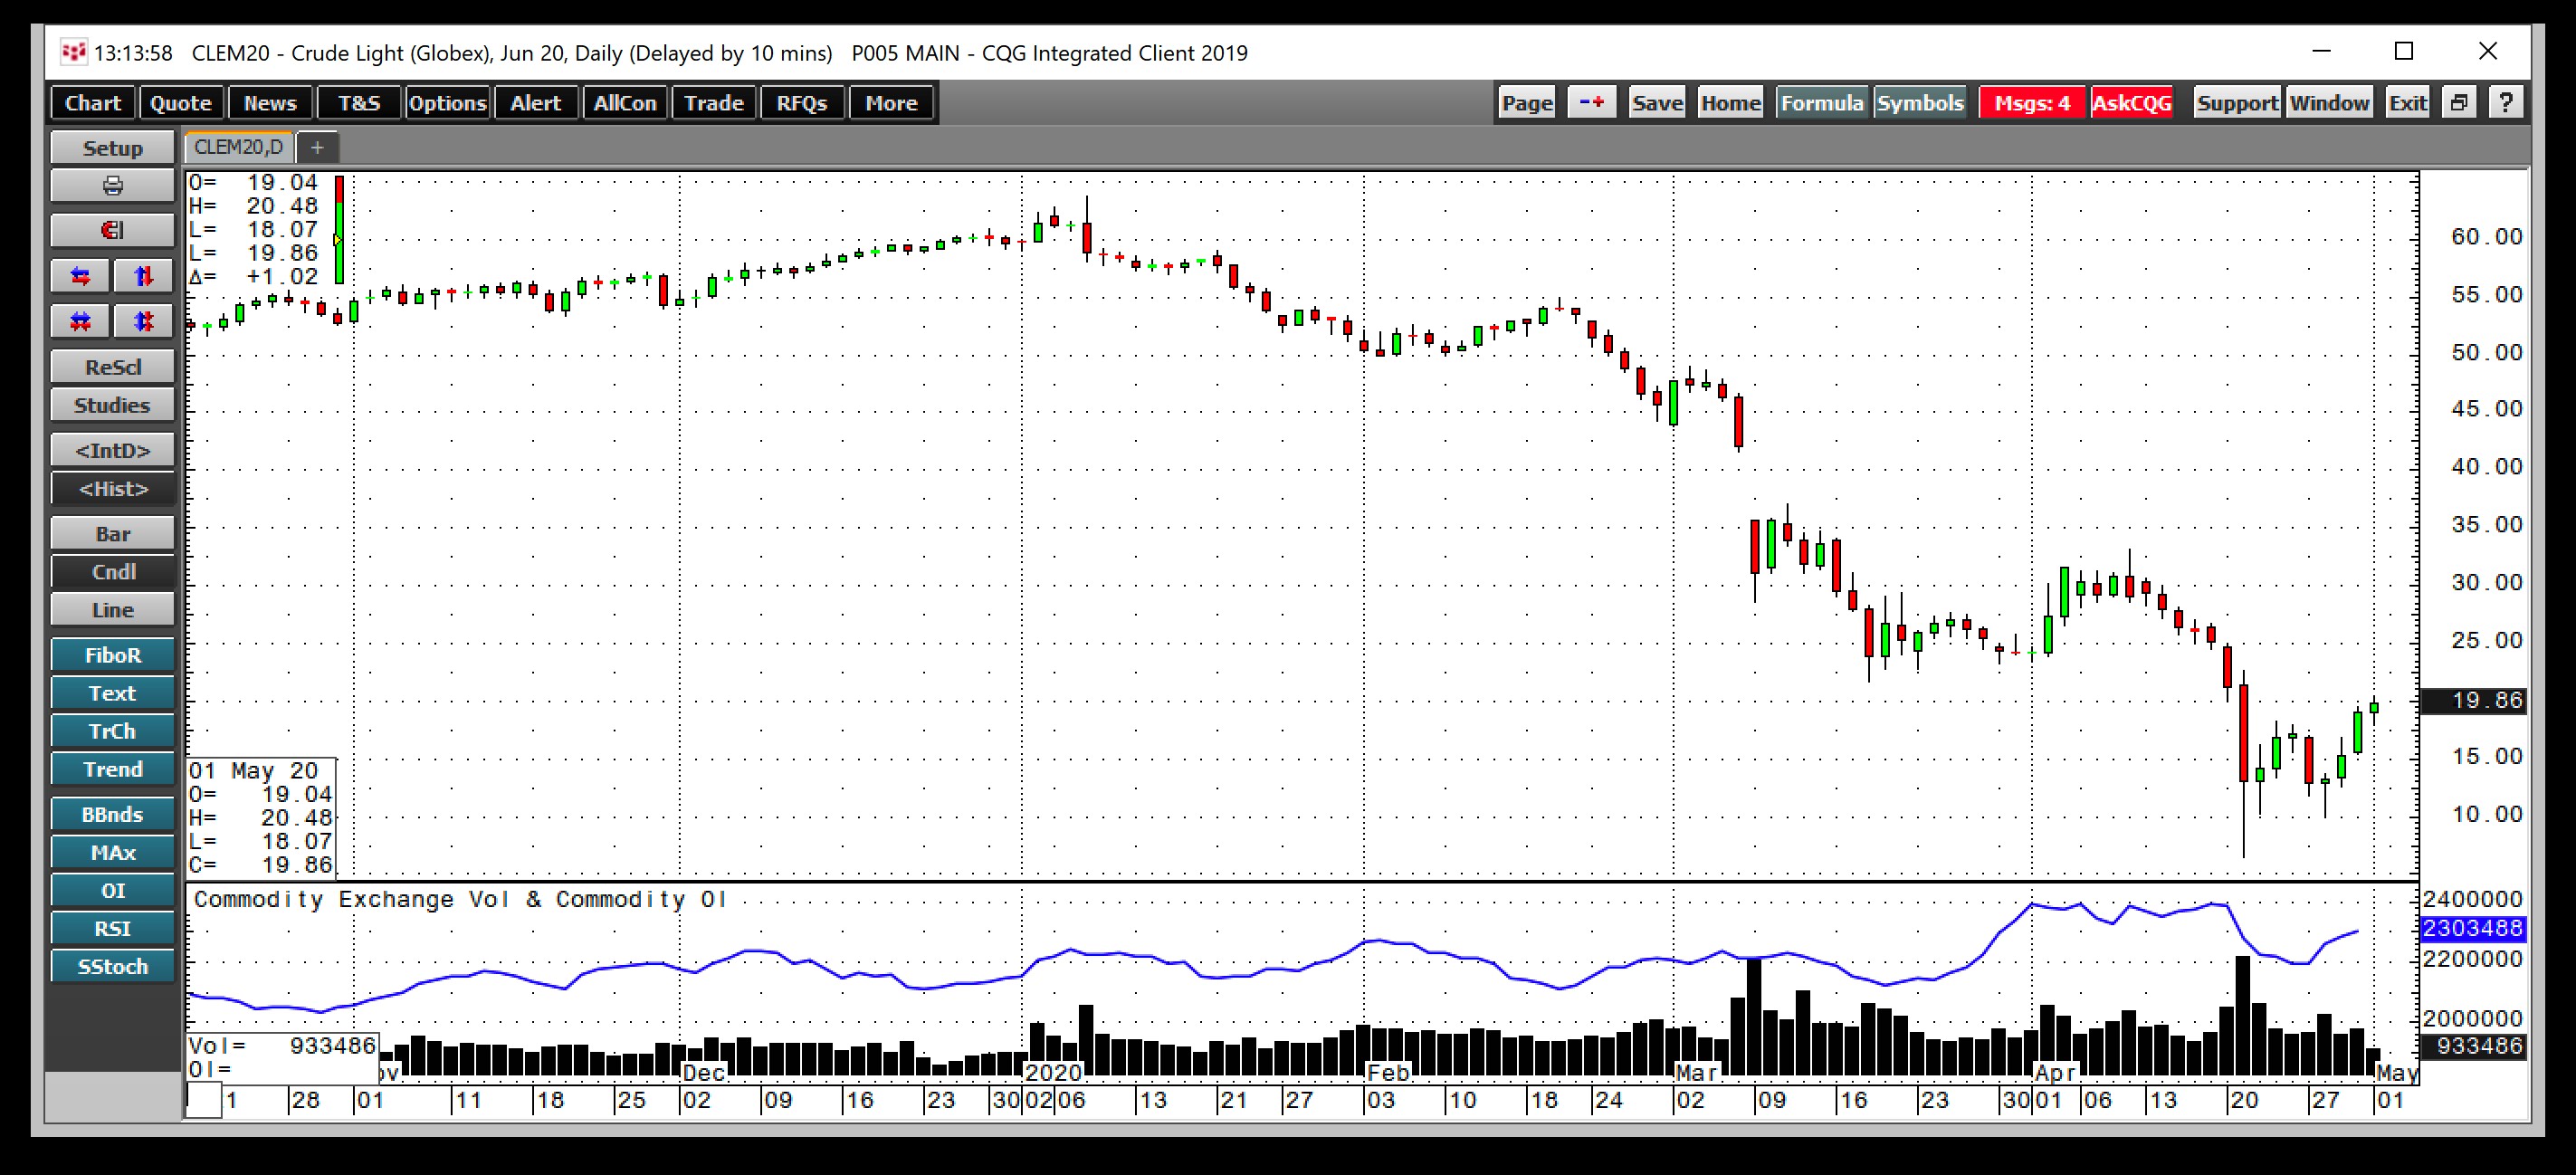
(Source: CQG)
The chart highlights that the open interest metric declined from a high of more than 2.39 million contracts on April 17 to a low of 2.19 million on April 24. The move into negative price territory as May futures rolled to June, and the most significant price swings in history likely sent many speculators to the sidelines. Meanwhile, the metric climbed back to the 2.30 million contract level by the end of last week as the price of oil recovered. Rising price and increasing option interest tend to be a technical validation of a bullish move in a futures market.
On a month-on-month basis, the price of nearby NYMEX crude oil fell from $20.10 at the end of March to settle at $18.84 on April 30, a decline of 6.3%. Shares of oil-related companies that had lagged the crude oil market throughout 2019 and over the early months in 2020 played catchup in April.
The S&P 500 Energy Sector SPDR (NYSE:XLE) had a surprisingly bullish month in April despite the price action in crude oil.
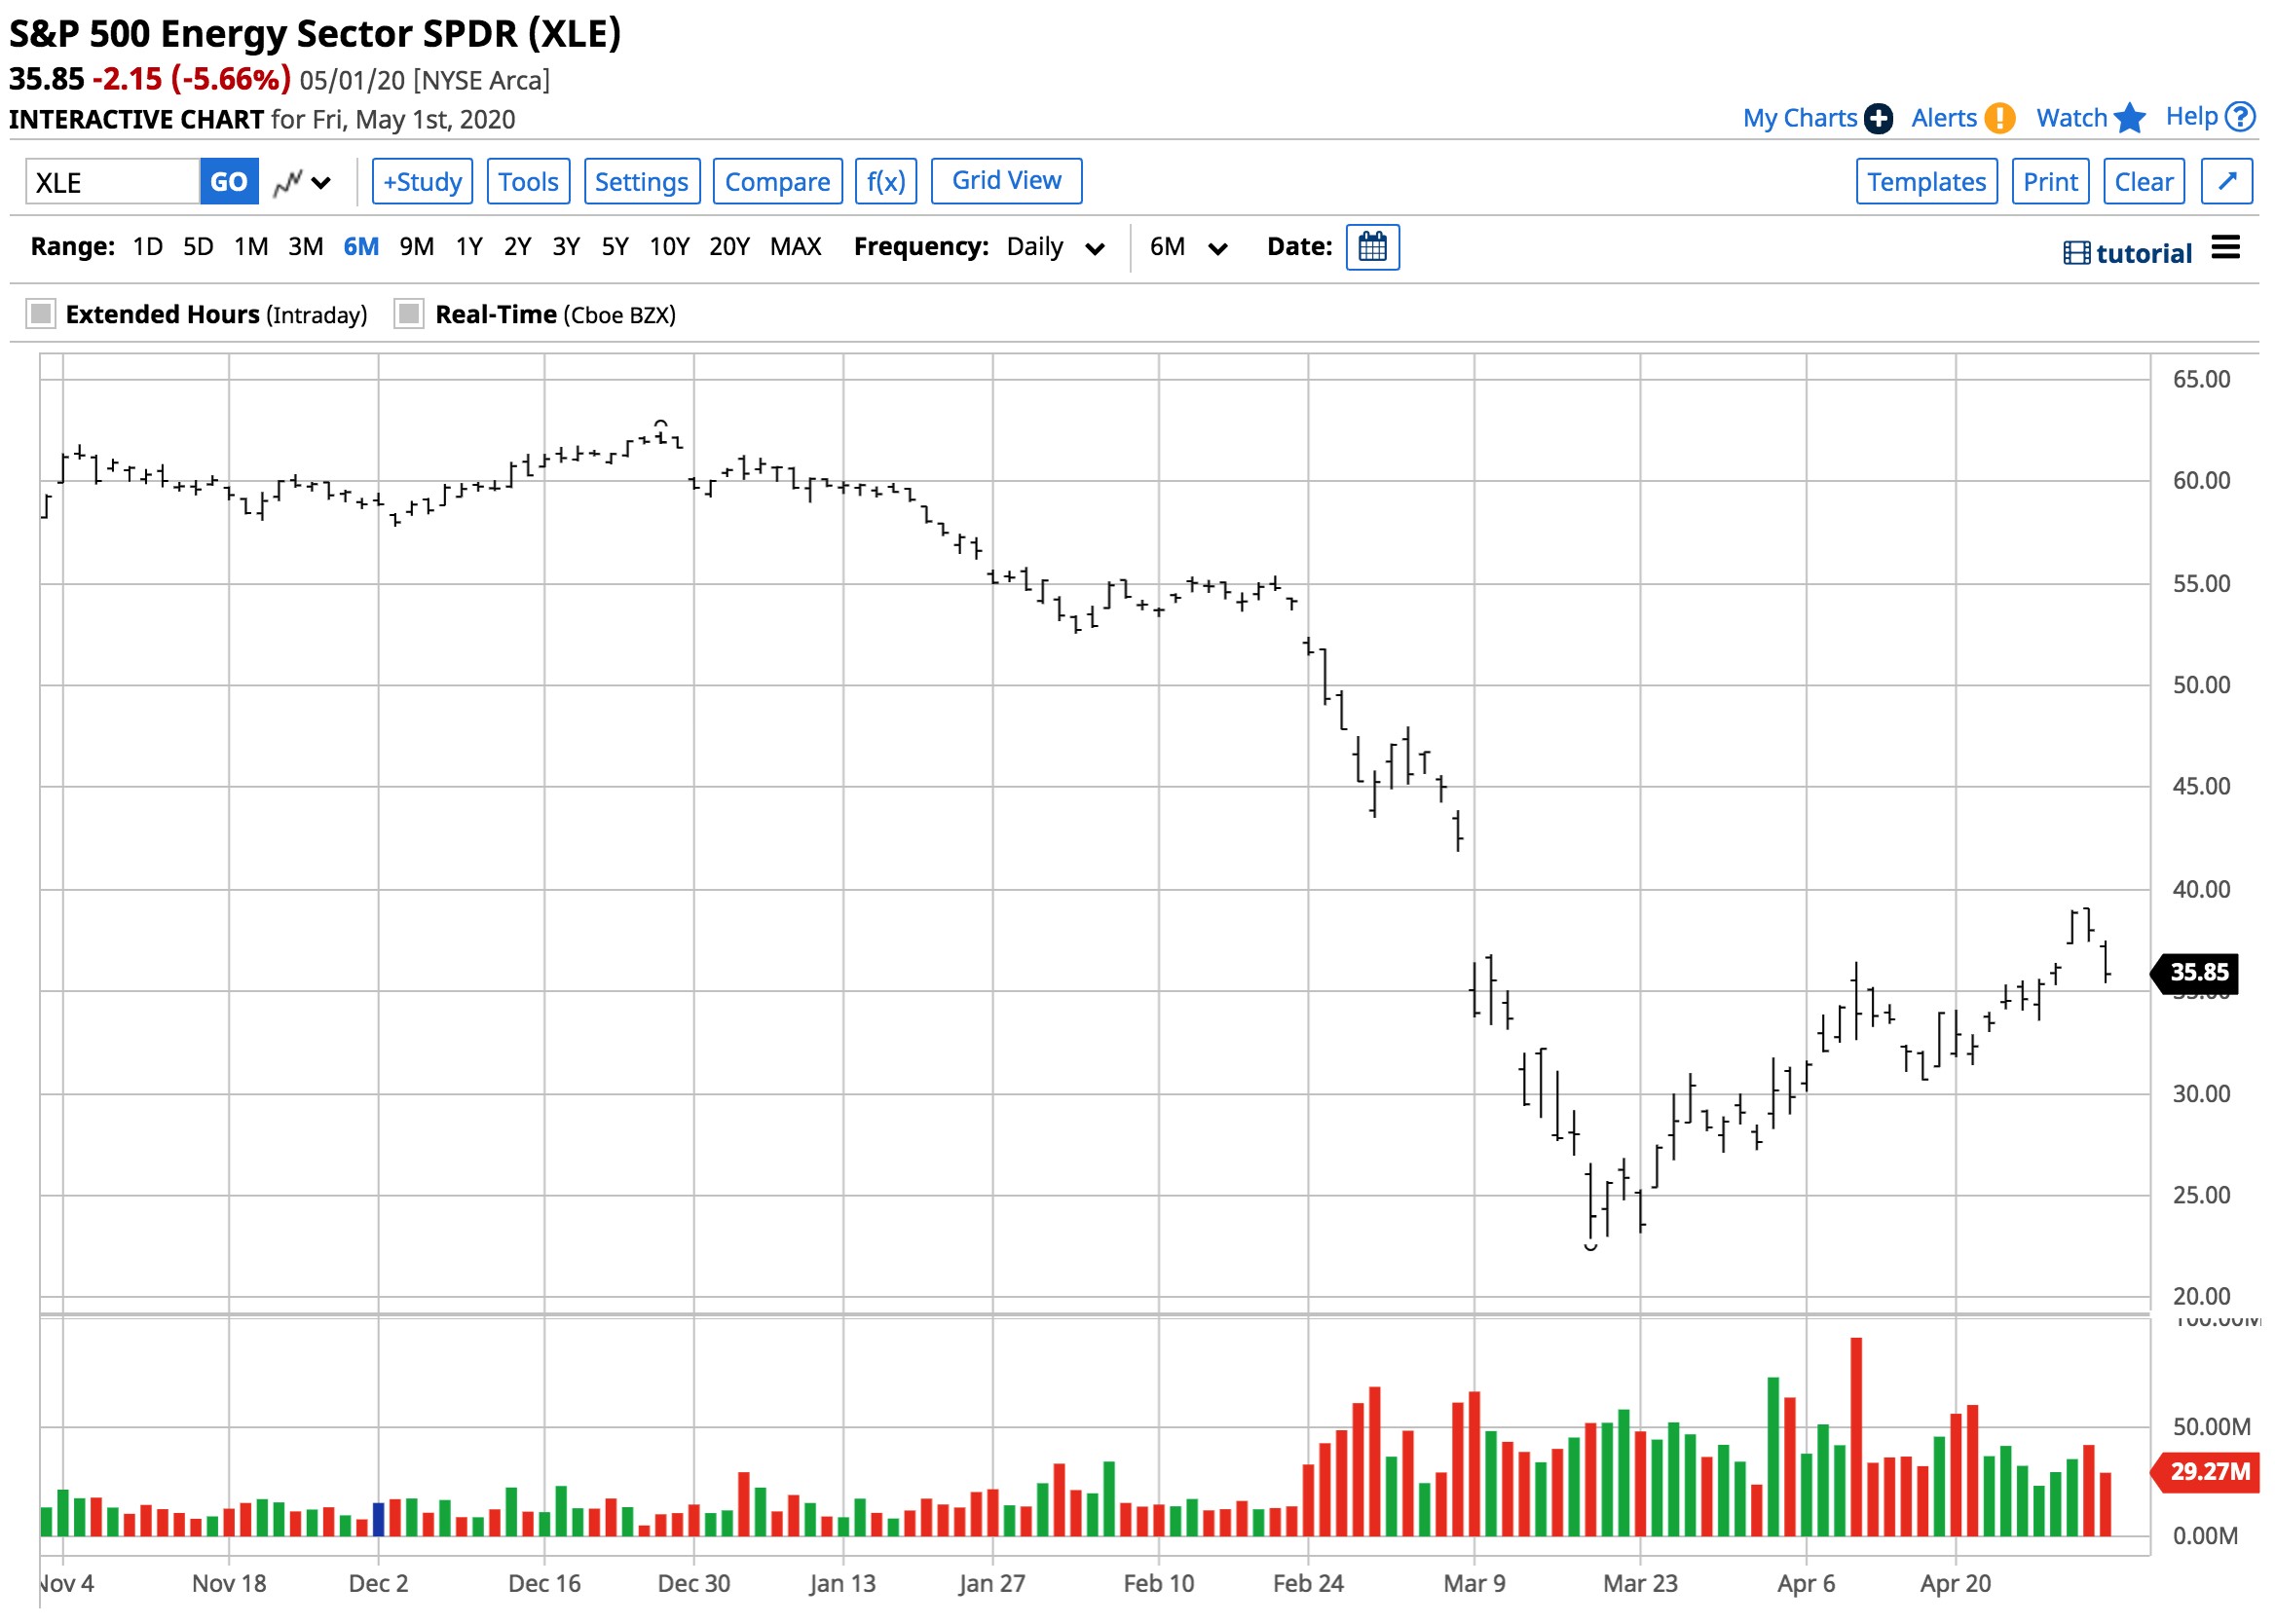
(Source: Barchart)
As the chart illustrates, the XLE moved from $29.06 on March 31 to $38.00 per share on April 30 or 30.8%. The XLE holds shares in many of the top oil-related companies. If the weakness in oil shares signalled the price carnage in the oil market, last month’s performance in the XLE could be telling us that the prospects for higher crude oil prices are rising. The XLE fell to the $35.85 level at the end of last week on the back of selling in the stock market on May 1.
Fear From May Will Remain - USO Trying To Find A Formula
USO is the ETF product that many market participants that do not venture into the futures arena look to for risk positions in the oil market. USO (NYSE:USO) avoided disaster in April as it rolled its hedges from the May futures contract before the April 20 price carnage. Since then, the administrators of the ETF have scrambled to change the structure of the product. It will now reflect a portfolio of futures contracts across the forward curve. Since the most price action occurs in the nearby futures contract, the effectiveness of the product when it comes to replicating moves in the price of crude oil could suffer.
USO has never been a robust tool for anything more than short-term performance because of the volatility of the term structure or price differences between delivery months in the NYMEX futures market. The move to spread the hedges across several months may result in an even less effective instrument for those looking to replicate the price action in the volatile energy commodity.
When it comes to the June futures contract on NYMEX, memories of May will take a long time to fade from the market’s memory. Expect lots of price variance in the crude oil futures market over the coming weeks and months as storage capacity remains as tight as ever.