
On June 4, I reported the tech-heavy indexes (NASDAQ and NDX) were most likely due for a correction. See my article here. I have outlined the publication date with the dotted green vertical line in the chart below.
The market continued to rally for four more days, and erased all those gains last week in a matter of two days. Since yesterday the tech indexes are back in rally mode. So is the correction I mentioned over?
My Elliott wave count shown two weeks ago depicted an ending diagonal pattern and price was according to my assessment in (green) wave-7. See Figure 1 below. That wave ended last week, and
since impulses are made up of 5, 9, 13, etc. smaller waves, yesterday’s low should ideally be wave-8 and now green wave-9 of black wave-5 is underway. Ideally, it will make a marginal higher all-time high but it is not a given as the last wave can fall short, or “truncate.” So don’t get too greedy up here.
Figure 1. NDX Daily Chart With Short-Term Elliott Wave Count
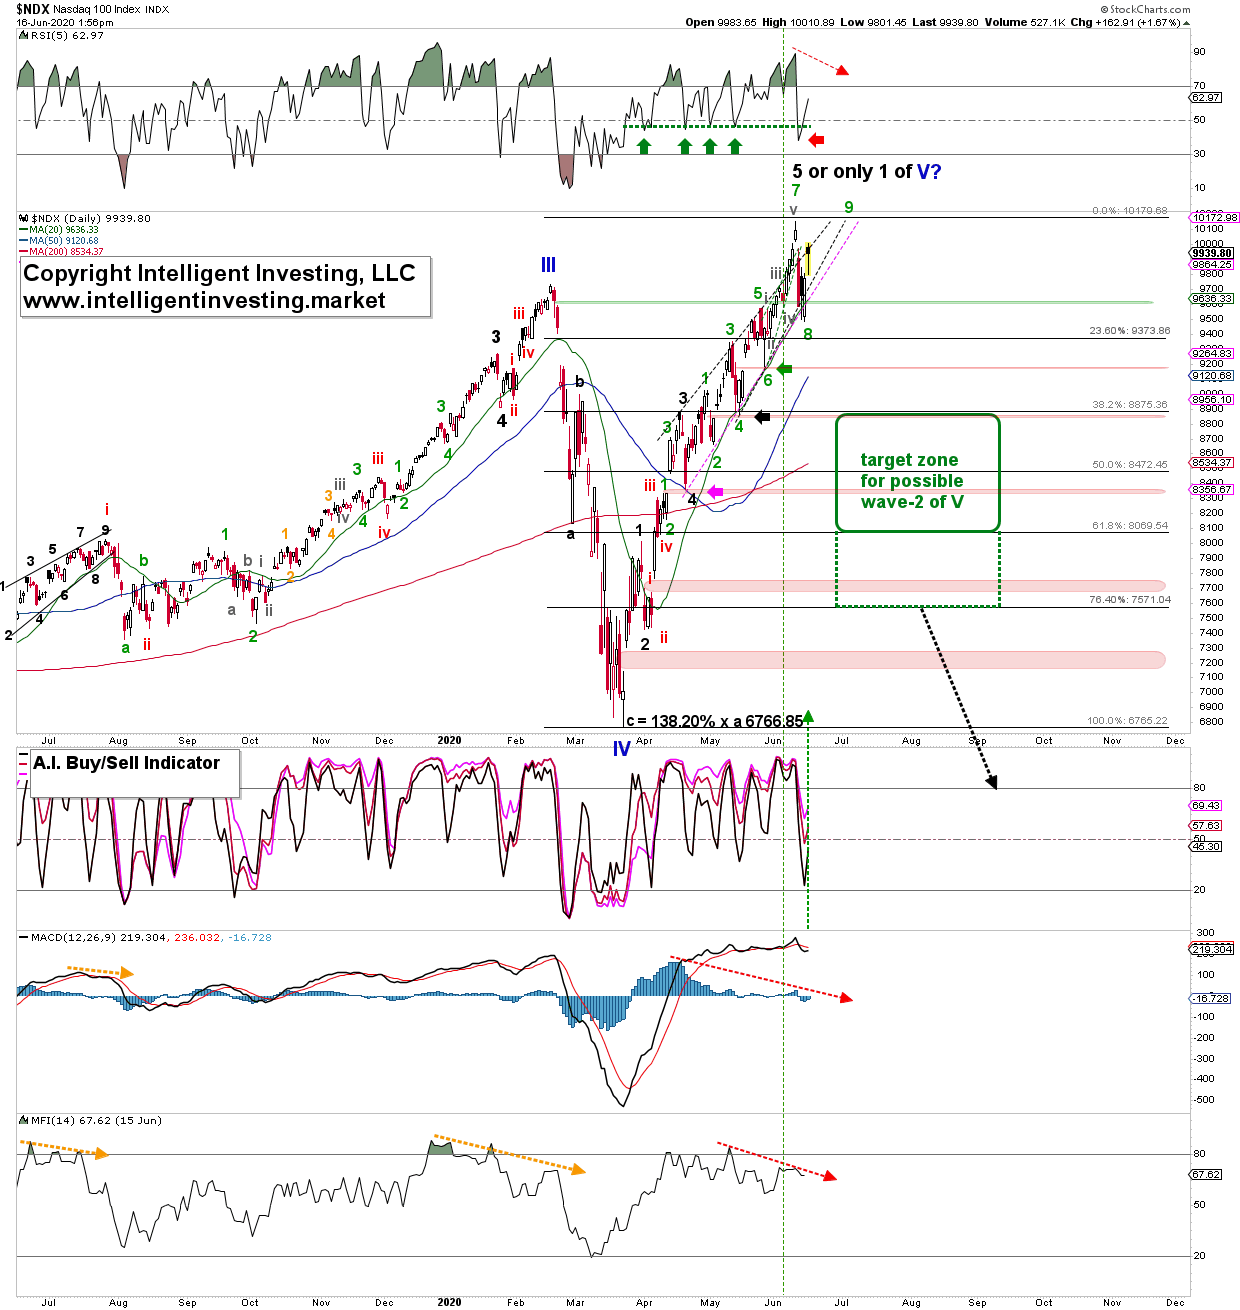
Although my proprietary buy/sell indicator (the A.I.) turned to “buy” today, and even though divergence is only divergence till it is not, the potential negative divergences on the other technical indicators (red dotted arrows) must be noted as they fit well with a final wave higher.
This week is monthly OPEX, which are generally bullish, but volatility often increases. Like we experienced already today with a swift intra-day drop. However, OPEX weeks generally have a bullish tilt, which fits with my a preferred Elliott wave count as well. However, the current OPEX is also a quarterly, and there have been some rather bearish quarterly OPEX instances in the past of late. Thus, taking (long) profits quicker and/or tightening up stops would not be a bad idea.
This brings me to the bigger picture Elliott wave count that I am tracking for the tech sector. It is namely possible the tech sector is wrapping up its last wave higher since the rally started the late-2002 low. See Figure 2 below.
Figure 2. NDX Monthly Chart With Long-Term Elliott Wave Count
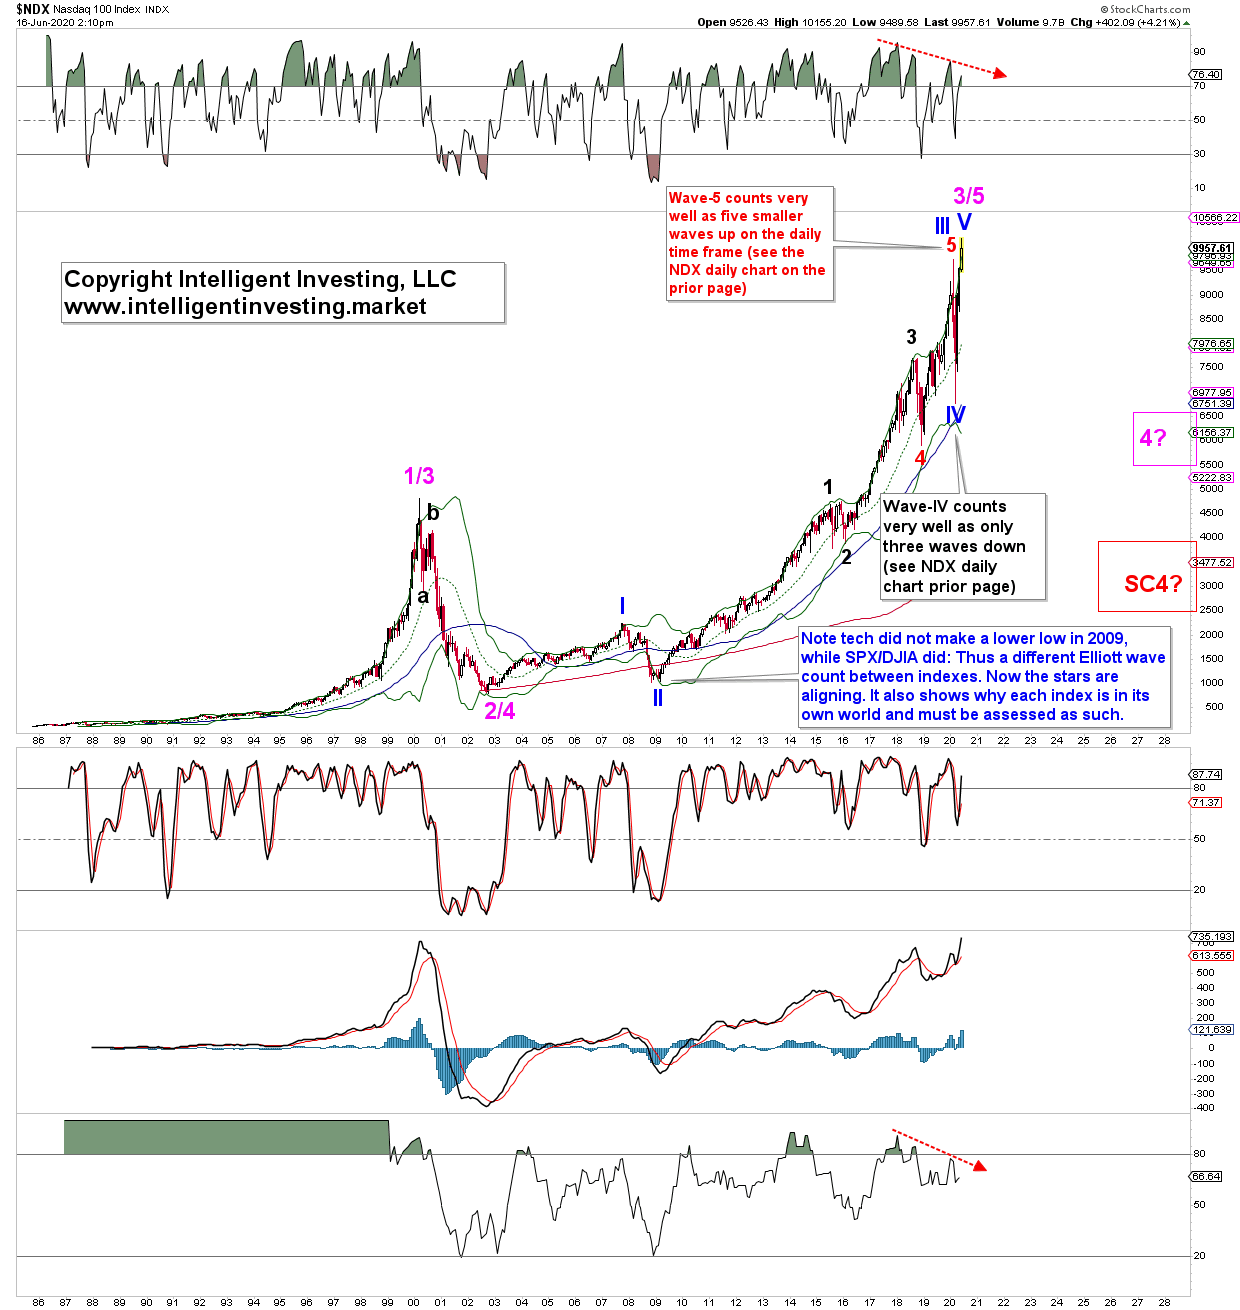
Now (blue) wave-I took five years, 2002-2007, so it is logical to expect more than a few months (March-June) for wave-V. But the extreme volatility we’ve had over this time period can allow for a very compressed wave. In the end, price is more important than time. Please note the negative divergences developing on the monthly time frame, like on the daily frame, suggesting this rally off the March low is closer to its end than its beginning.
The alternative is, as shown on the daily chart in Figure 1, that the recent rally was only wave-1 of V and price will do a move back down to the green target zone ($8,070-$8,875) for wave-2, before wave-3 to new ATHs starts.
To be determined is A move and close below the 76.40% retrace of the March-June rally ($7,570) will tell us the “big bad bear” has likely started as second waves rarely move that low.
Bottom line: The upside potential versus the downside risk is intermediate-term is not as good as it was even a few weeks ago. Know your time frame and trade accordingly.