
Despite all the bad economic news, civil unrest and mass unemployment, the Nasdaq 100 made a new intra-day all-time high. This miraculous recovery already tells us the financial markets are not the economy. Or should they? That is a discussion for another time. As traders, investors and market analysts, one must assess the markets for what they are, not for what we would like them to be.
Today’s higher high means the February high was, I believe, a larger third wave top. The index did then three waves down (a, b, c) into the March low. At that low wave-c was 1.382x wave-a. In Elliott wave
terms, that is called a classic corrective zig-zag pattern. Since that low, the index has made five waves up (1,2,3,4,5) with the last fifth wave made up so far off seven (green) smaller waves that are forming a clear wedge-shaped pattern (dotted black and purple lines). In Elliott wave terms, that is called a diagonal. Since in this case, it is a terminal wave, it is an ending diagonal. Moreover, the index is making what appears to be another diagonal off last week's low: green wave-6 (green dotted lines).
Figure 1. NDX daily chart with Elliott Wave Count and several technical indicators.
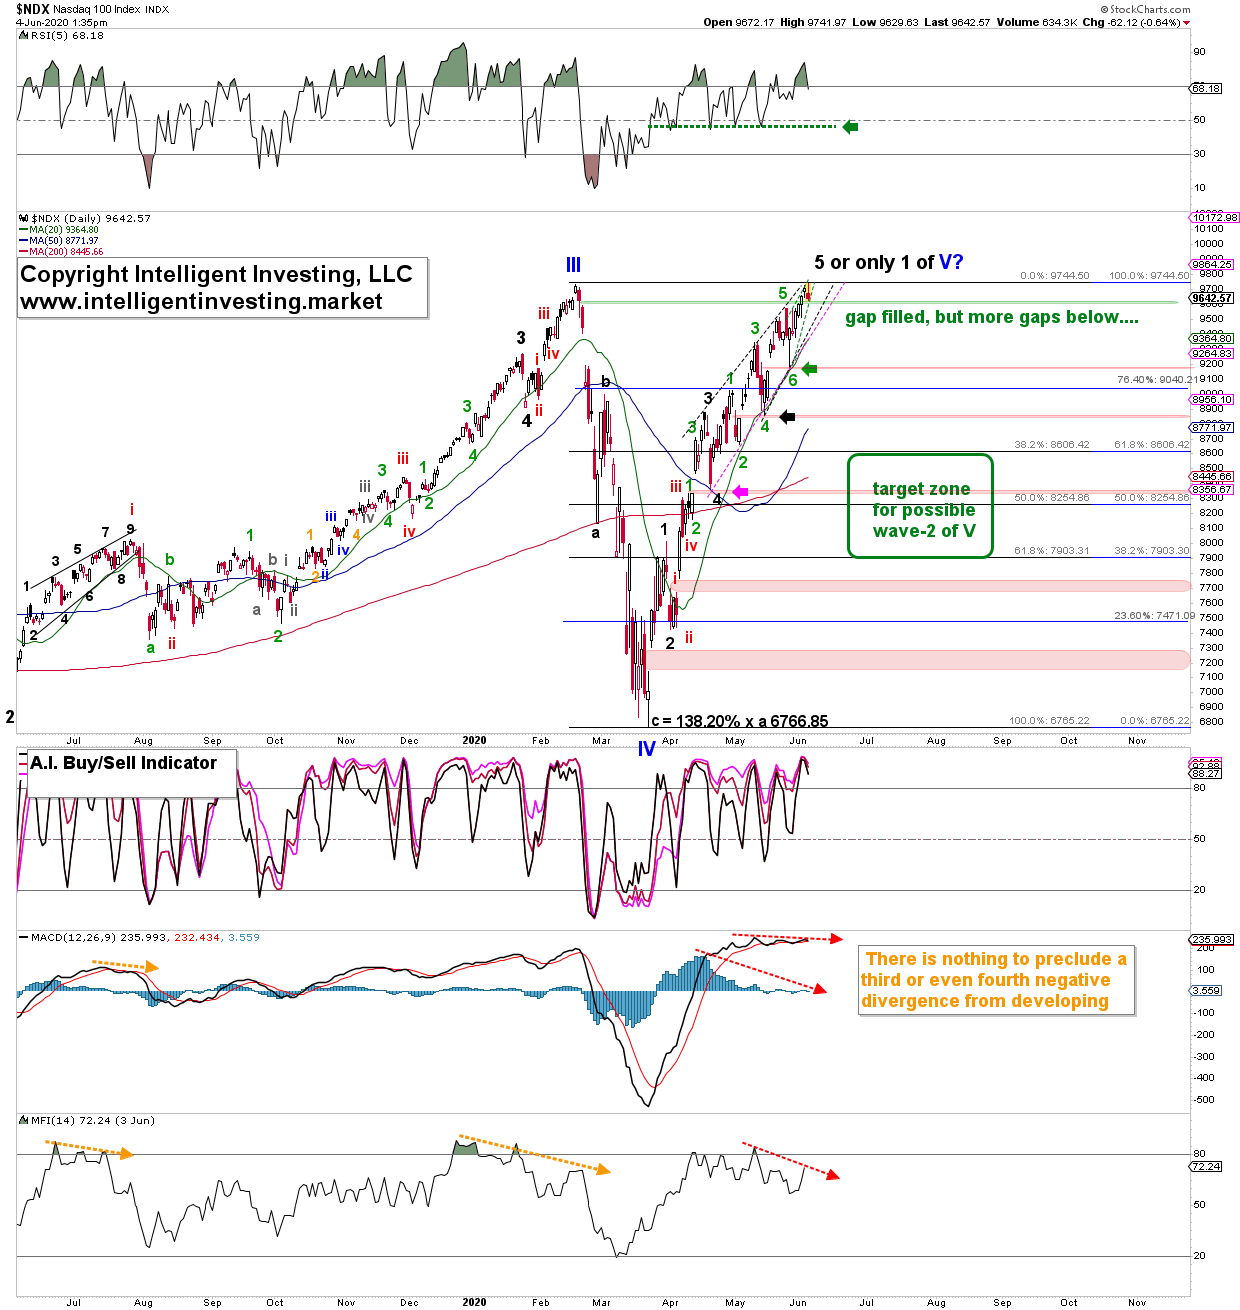
Ending diagonals are terminal patterns, and price often "collapses" out of it once the pattern completes.
Although divergence is only divergence till it is not, the technical indicators are mostly diverging (dotted red arrows) indicating the current rally is losing momentum. Compare this with the dotted orange arrows. With the potentially three ending diagonals in play, the stars are thus starting to aligning for a correction.
Downside targets to look for are
A) last week's low (green arrow),
B) the mid-May low (black arrow),
and C) the mid-April low (purple arrow).
Interestingly, all three would allow for the small gaps to get filled.
Besides, the purple arrow at around $8,350 also falls well within the (green) potential wave-2 of wave-V target zone.
The jury is still out there on if the current rally was all of the blue Primary-V wave, or if it was only the first wave. If it was all of wave-V, then the index will move well-below the March lows over the coming months and years. If the recent rally was only wave-1 of V, then we can expect a few more years of sharply rising prices, despite the economic mess the world is in, before the real Bear market kicks in. In that case, March was only a sample of what to expect next.
If this year has taught us anything, it is to not take anything for granted. In February, nobody expected the index to make a 30-45% round trip (30% down, 45% back up) in a few months. As always, we will have to monitor the price action over the coming weeks and months: anticipate, monitor and adjust. If price stalls in the green target zone and rallies: expect wave-V to continue. If the index is unable to hold the green target zone and moves below the early April low, I anticipate a multi-year bear market.
Know your timeframe. Trade it accordingly.