Emerging markets are performing very well lately. We have indicated in several articles why, and indicated which emerging stock markets are worth considering. One of the many questions of readers we received this week is whether the Singapore stock market is a buy opportunity in 2017? This post provides clues for investors.
News on the Singapore stock market is becoming increasingly bullish. It has been very quiet around Singapore in recent years but that is changing as the stock market in Singapore is making new 12-month highs. According to Reuters, as published by Bangkok Post, the Singapore stock market closed at their highest level since October 2015 with telecoms and industrials driving the gains.
Moreover, Bloomberg notes that the uptrend in the Singapore stock market in 2017, so far, is closely tracked by an uptrend in Hong Kong stocks. Bloomberg writes that:
“Both stock indexes have become the best performers among global developed markets, returning about twice as much as third-place New Zealand this month through Monday. Property stocks are the driver in Singapore, while AIA Group Ltd. (HK:1299) and Tencent Holdings Ltd. (HK:0700) have lifted the Hang Seng Index in Hong Kong.”
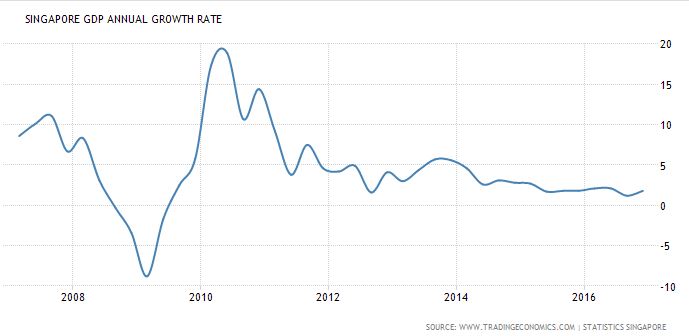
Although InvestingHaven’s research team is not focused on fundamental data it notes that GDP annual growth in Singapore has stabilized after a serious decline since 2010. Right now, the GDP growth can only go higher as it reached only 1 percent annual growth last year. Though that is not a primary indicator, it underpins a potential rise in Singapore’s stock market.

Chart courtesy TradingEconomics
Singapore stock market breaks out as 2017 starts
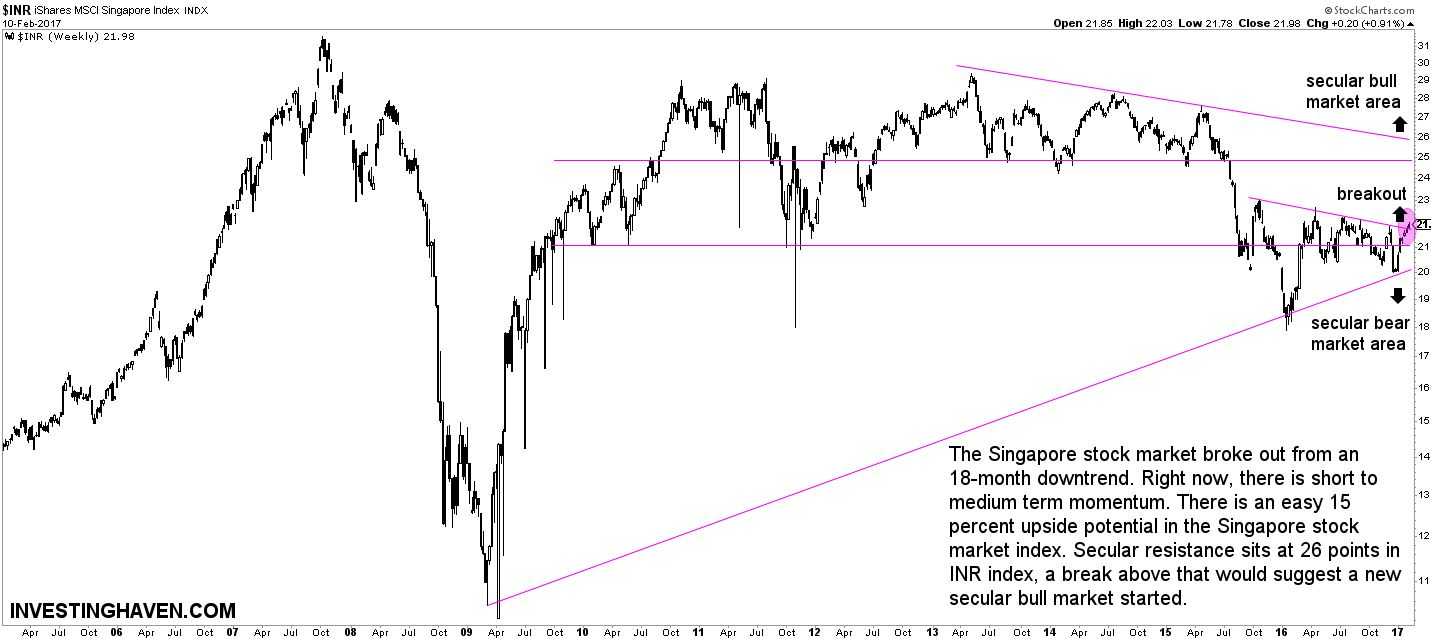
According to InvestingHaven’s research team, the Singapore stock market broke out from an 18-month downtrend, also noting that “investors better get in early after a breakout.” Right now, there is short to medium term momentum which suggests an easy 15 percent upside potential.
The very long term chart of Singapore’s stock index, which is tracked by INR, the MSCI Singapore Index (below chart), shows how secular support was tested last December. Things looked scary at that point in time, but not only did the index recover, it also broke out from its downtrend.
Investors want to see a break above 25 points (horizontal line on the chart) but also 26 points (see falling trendline). Once above 26 points, it is likely that a secular bull market will have started. Obviously, what happens as the stock market will test all-time highs will also be telling, but that’s probably not going to happen in 2017.

