It was a big day for the NASDAQ market yesterday, which succeeded in making new all-time highs for the first time in 15 years, by finally breaking above its Tech bubble highs of 2000, but as we will see, there will likely turn out to be little to celebrate, except perhaps the opportunity to sell, or to short, near to the highs.
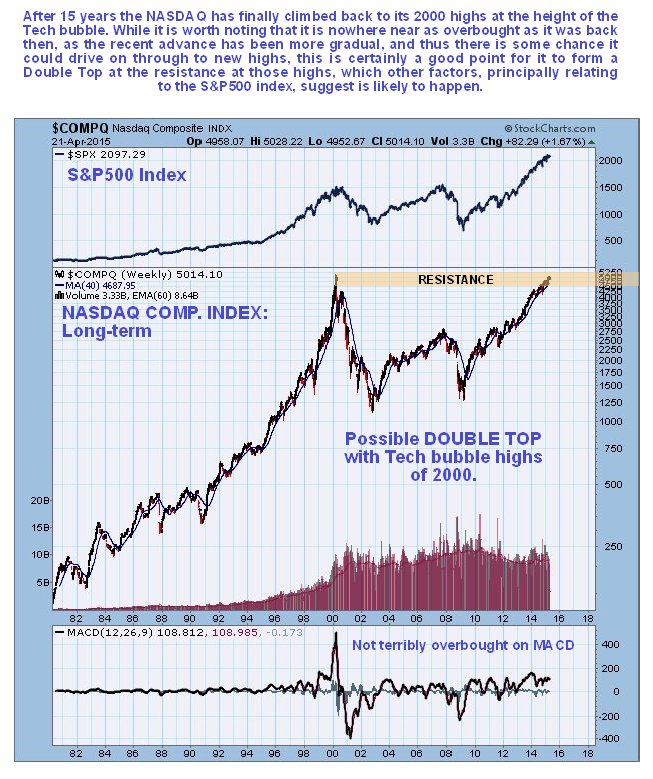
On the long-term chart going way back to 1980 we can see how, after the long bullmarket from its 2009 lows, in parallel with the broad market, the NASDAQ has at last arrived at the resistance at its tech bubble highs of 2000, where there is potential for a Double Top to form. While it made a new high by a whisker yesterday, it is far from breaking clear of the resistance near those old highs.
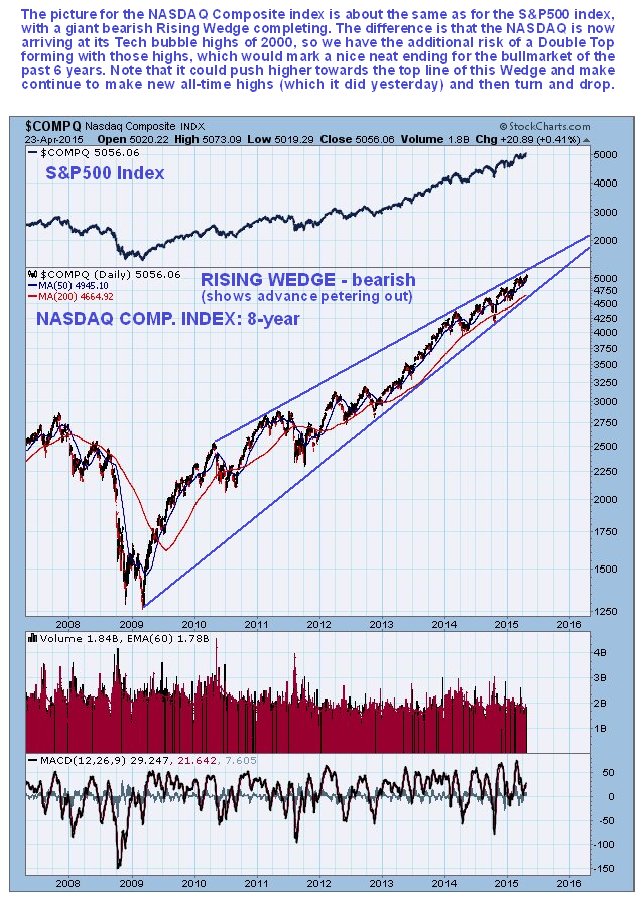
What suggests that a Double Top is likely to form here is the bearish Rising Wedge that is completing and closing up, which we can see on the 8-year chart. This Wedge parallels the one completing in the broad market S&P 500 index. While there is some risk of a “throwover” breakout above the top boundary of the Wedge, which could lead to short, sharp rally as shorts are frightened out of their positions, this would be expected to be followed by an abrupt reversal back into pattern and then a steep drop. Otherwise the index should not get above the upper boundary of this Wedge before turning lower. In any event, with the Wedge now closing up, we are going to see a resolution of this pattern soon.
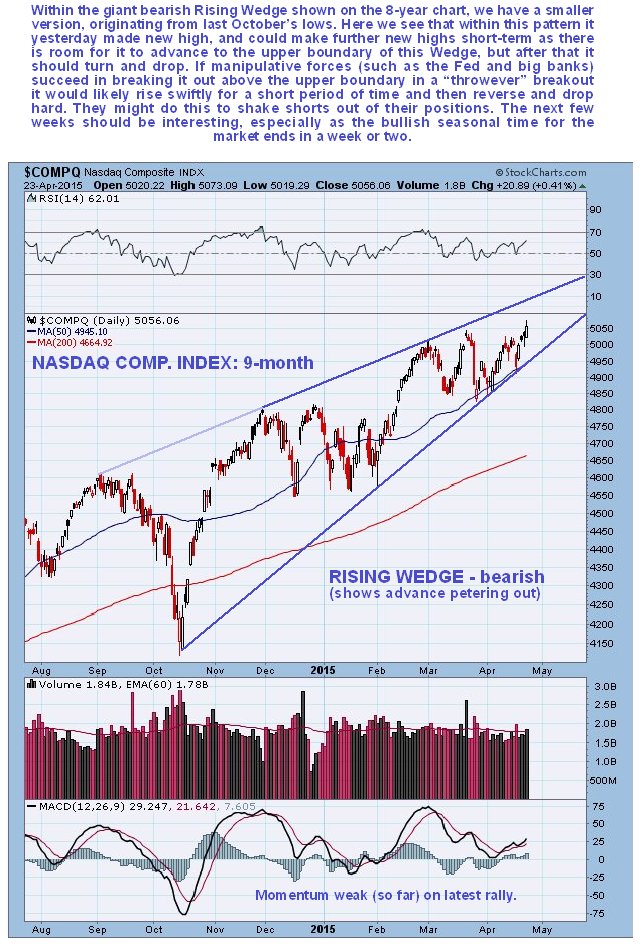
Interestingly, within the giant Rising Wedge we can see on the shorter-term 9-month chart that a smaller Rising Wedge is also approaching completion, which again parallels what is going on in the broad market. Awareness of the bearish implications of both of these Wedges, the giant one on the long-term chart and the smaller one on the shorter-term chart, means that we are not fooled by the index making new highs into thinking that everything is fine with this market. On the 9-month chart we can see that there is room for some further gains before it hits the upper boundary of the converging channel.
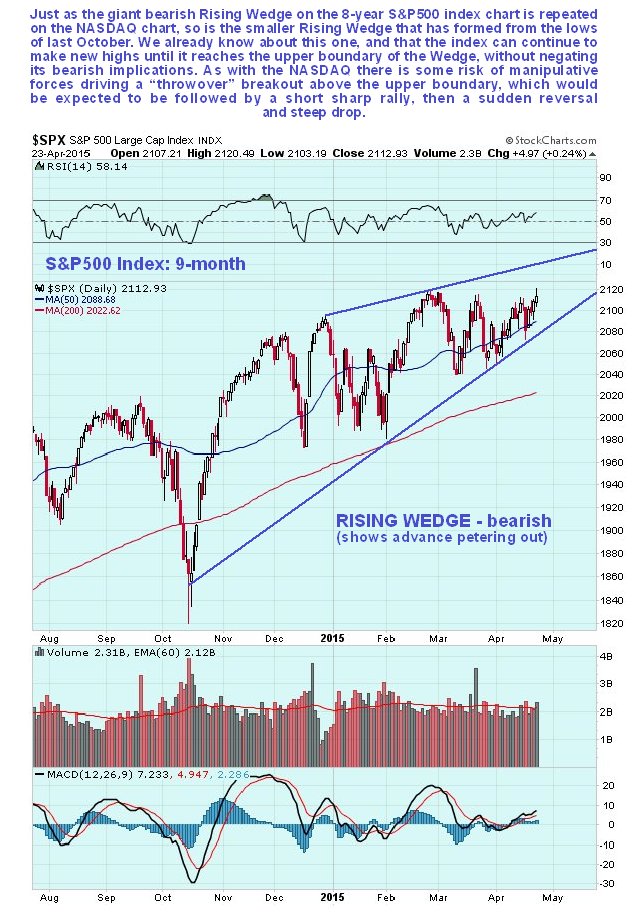
The 9-month chart for the S&P 500 index shows the parallel Rising Wedge completing in this also, where again we can see room for further short-term gains.
The same thing is happening with the London FTSE 100 which is making (marginal) new all-time highs, where another Rising Wedge is visible.
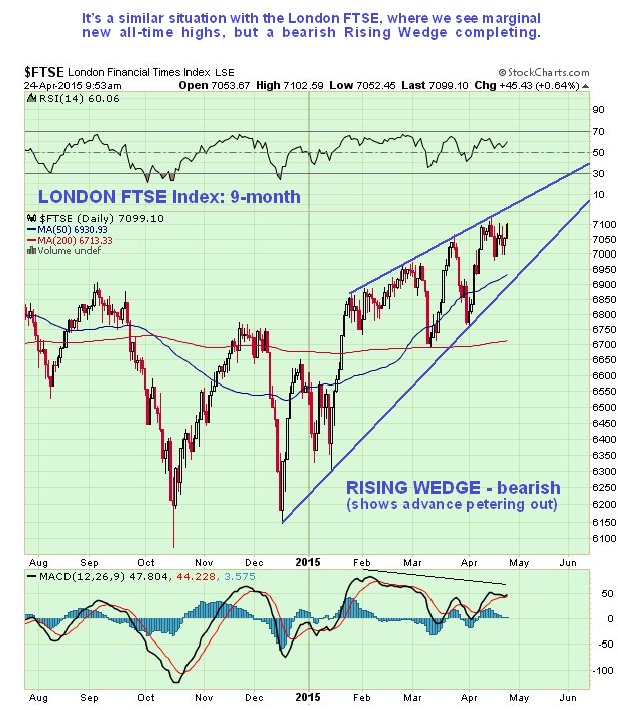
The conclusion to all this is that we should not be fooled by continuing new highs in various markets over the near-term. These markets appear to be at the tail end of their long rallies and once the usual seasonal supportive factors disappear next month, they are likely to go into reverse. Even an upside breakout from these Wedges would be suspect, especially as the technical indicators that we have already examined elsewhere show extreme internal weakness.
