Another wild week for oil traders with missiles flying and huge overnight price swings in crude. As we recently pointed out within our current Oil research article, Oil and the Energy sector may be setting up for another great trade. We recently commented on how the supply/demand situation for oil has changed over the past 20+ years.
With US oil production near highs and a shift taking place toward electric and hybrid vehicles, the US and global demand for oil has fallen in recent years. By our estimates, the two biggest factors keeping oil prices below $75 ppb are the shift by consumers across the globe to move towards more energy-efficient vehicles and the massive new supply capabilities within the US.
Our researchers believe the downside price rotation in Crude Oil early this week, after the US missile attack in Iraq, suggests that global traders are just not as fearful of a disruption in oil supply as a result of any new military actions in Iraq, Iraq or anywhere near the Middle East. If there was any real concern, then the price of Crude Oil would have spiked recently.
We talk more about what we expect with oil both the bullish and bearish outlooks in this recently recorded conversation with HoweStreet.
Inverse Energy ETF
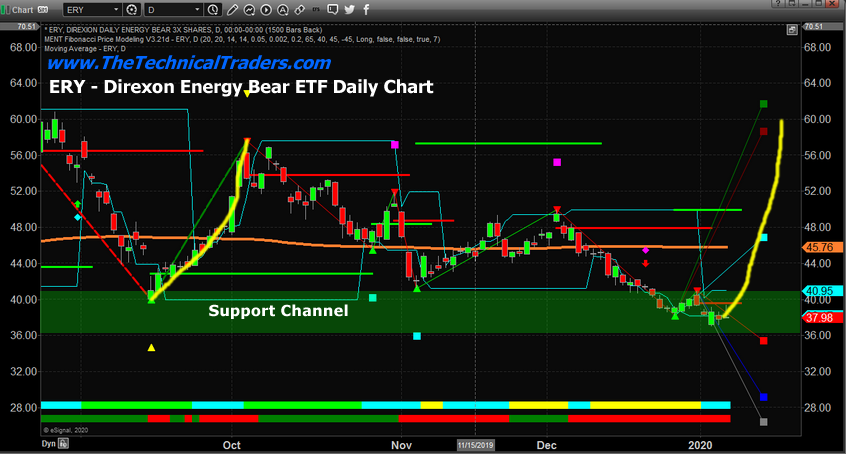
This leads us to believe the inverse Energy ETF, ERY, maybe setting up a very nice bottom in price below $40. Ultimately, we believe a deeper price bottom may set up in the next 10 days where ERY may trade below the $36~37 range, but time will tell if we are correct about this or not.
Historically, price levels below $40 have resulted in some very nice long trade setups in ERY. This ERY daily chart highlights the support channel we believe exists in ERY and why we believe any entry-level below $36 is an outstanding entry point for any future upside price move.

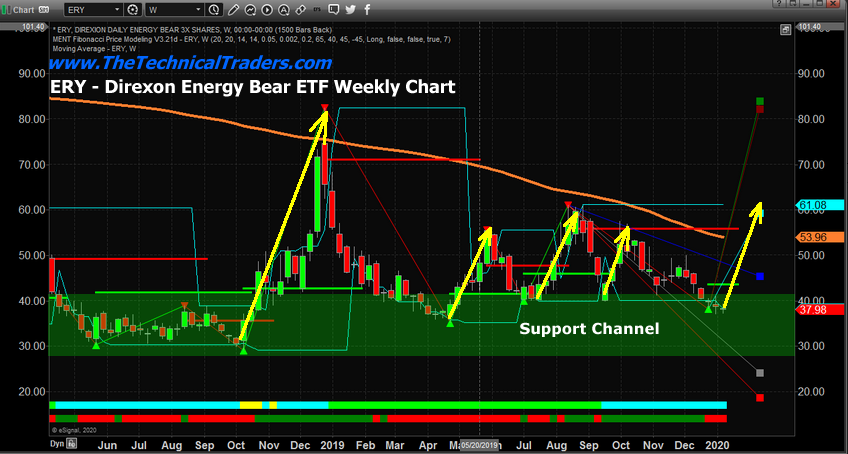
This weekly ERY chart highlights the past rallies that have originated from within the support channel. Pay special attention to the size and scope of these moves. The October 2018 rally resulted in a 183% price rally. The April 2019 rally resulted in a 57% price rally. The July 2019 rally resulted in a 50% price rally and the last move in September 2019 resulted in a 41% price rally.
Could this next setup in ERY be preparing for another 40% to 60%+ upside price rally?

We believe the setup in ERY is very close to generating an entry trigger. We have not issued any new trade triggers for our members-only service as we are waiting for confirmation of a potentially deeper price move in ERY. Right now, get ready for what may become a very good setup in ERY over the next few weeks.
Watch what happens in the energy sector over the next 30 to 60 days. We may be setting up for a fairly large price rotation as the tensions spill over into the global markets and precious metals. We may find that oil is the big loser over the next 60+ days.
