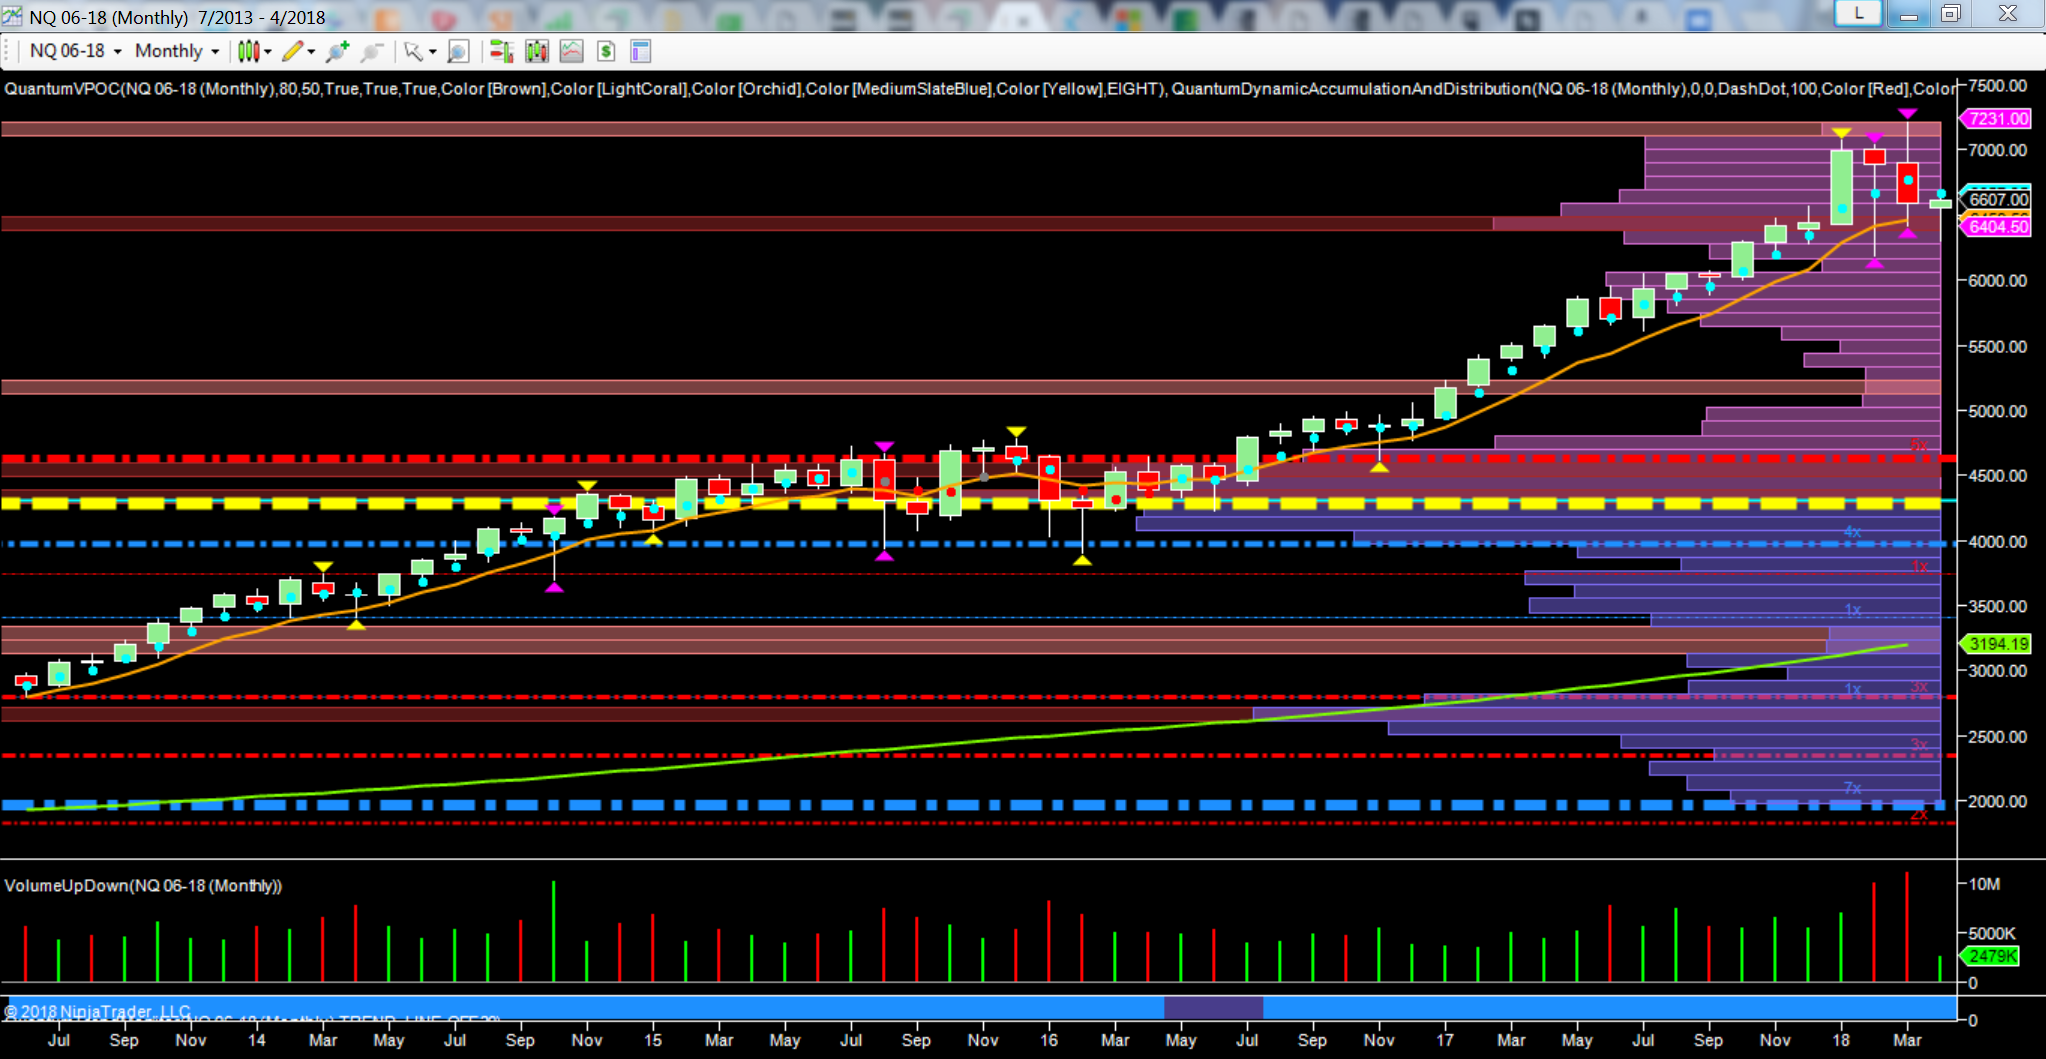
Given the level of market volatility that traders and investors have had to ensure since the start of the year, now may be a good time to consider some of the longer term charts, and in particular the June contract for the NQ e-mini. And also to consider whether we are looking at the first serious market correction since 2009.
I have selected this chart primarily because the NQ is the futures contract for the NASDAQ 100, which is the index that is the most sensitive to any major change in both the business and economic cycle. In other words, it can be considered a leading indicator for the US economy, and together with its sister index, the S&P 500, it will also influence the performance of global indices. Second, two of the most important companies in the index, namely Facebook (NASDAQ:FB) and Amazon (NASDAQ:AMZN), have recently been in the spotlight, with Facebook suffering a serious fall in its price following questions about its use and abuse of user's personal data.
By contrast Amazon has felt the negative effect of the Donald Trump tweet in which the US President has suggested the US postal service, and by extension US tax payers, are subsiding the company with cheap postal rates. However, commentators have also suggested Donald Trump’s criticisms of Amazon are personal and political given Jeff Bezos’s ownership of The Washington Post newspaper which has been critical of Trump.
But to return to the monthly chart of the NQ, in particular I want to consider the chart through the prism of my methodology of volume price analysis. For those of you unfamiliar with this approach this methodology is not new and is premised on the work of Richard Wyckoff, and in particular his three laws. In addition VPA considers the market from the inside out. In other words, at the top of a major bull trend volume price analysis traders and investors would consider this not only a distribution phase, but also a ‘selling climax’, as it is the insiders selling out to those market participants fearful of missing out. It is when the FOMO effect is at its most powerful.
And looking at the February and March candles for the NQ, this is what seems to be in evidence given the extreme volatility and volume.
Following a surge higher in January 2018 this candle ended the month with a wide spread that took the index to an all time high of 7073. However, the volume that is associated with this candle gives us the first warning that something is not quite right as it is violates Wyckoff’s third law of effort and result. In this case we see a big result on relatively little effort. February’s open then suggested the index was likely to continue its bullish tone, but the meltdown in the leveraged VIX ETF market unleashed a degree of volatility not seen since the flash crash of 2015. On this occasion and in February the VIX spiked to over 50, before closing at 28 and 19 respectively.
In terms of the price action and volume for February the resulting candle was a hanging man candle on very high volume which also triggered our Quantum volatility indicator as the price action for the candle over this period was outside of its average true range. And it is the appearance of such a candle at the top of an extended trend coupled with volatility that is a huge warning signal. This candle is not, as some believe, a bullish signal that the trend is set to continue, although such an interpretation is understandable as the candle has a deep wick to the lower body and on this occasion is also associated with high volume. In fact the reverse is true as this is the first major sign of very heavy selling which is only reversed by the FOMO buyers who rush in on dips. And this price action is also helped by the insiders selling into weakness.
Volatility continues into March and despite the NQ hitting a fresh high of 7214 the price action on the month is characterized by further heavy selling and volume, and the candle closes out with wicks to both the top and bottom.
And so to the beginning of April, and the start of the new trading week and month, which so far has seen continued selling with the index falling to 6306 on trade war fears before rallying once again to trade in the 6580 region at time of writing.
So the question now is what next for the NQ and the markets in general. Will this present correction simply correct itself, and the markets regain their equilibrium and bullish momentum in the coming days and weeks? Or is the price action, volume and volatility we have seen since the start of the year heralding something far more serious. In other words, is this the start of the Big Short? The price action and associated volatility would certainly suggest this is the case as what we are witnessing is the classic climatic price action which is a characteristic of major market turning points. And the reason for this is simple, as volatility and whipsaw price action is the mechanism by which the insiders distribute at a top or accumulate at a bottom.
Finally if we are indeed looking at a major correction any fall could see the NQ back to test support at the 5500 region, and if this is breached on heavy volume we may even see a return to the 2016 levels at the 4500 area.
