Get 40% Off
🚨 Volatile Markets? Find Hidden Gems for Serious Outperformance
Find Stocks Now

Is Nike’s Chart Signaling A Massive Crash?

Published 06/28/2019, 02:01 PM
Updated 07/09/2023, 06:32 AM

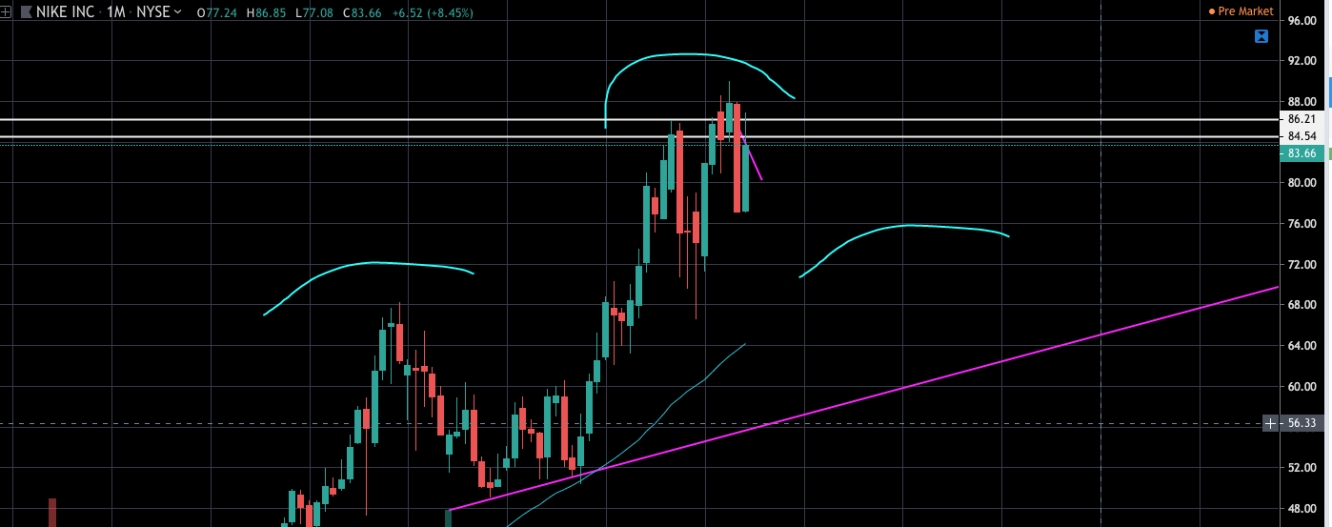
The chart below is Nike’s (NYSE:NKE) monthly chart forecasting a bearish head and shoulders pattern. I use this timeframe to look at the bigger picture of any stock I consider trading (long-term or short-term). A novice trader may see a bullish pattern in the near-term, but they can get burned, especially, when there is a catalyst such as earnings on the horizon. The longer the timeframe, the more reliable the chart pattern. Coincidentally, or not, Nike missed earnings for the first time in 27 quarters and with tariffs looming we could see a continuation in this trend.
Nike

The left and right shoulder are typically a similar distance in time apart from the head. Given it took two years to form the left shoulder, we can expect it will take a while for this pattern to play out.

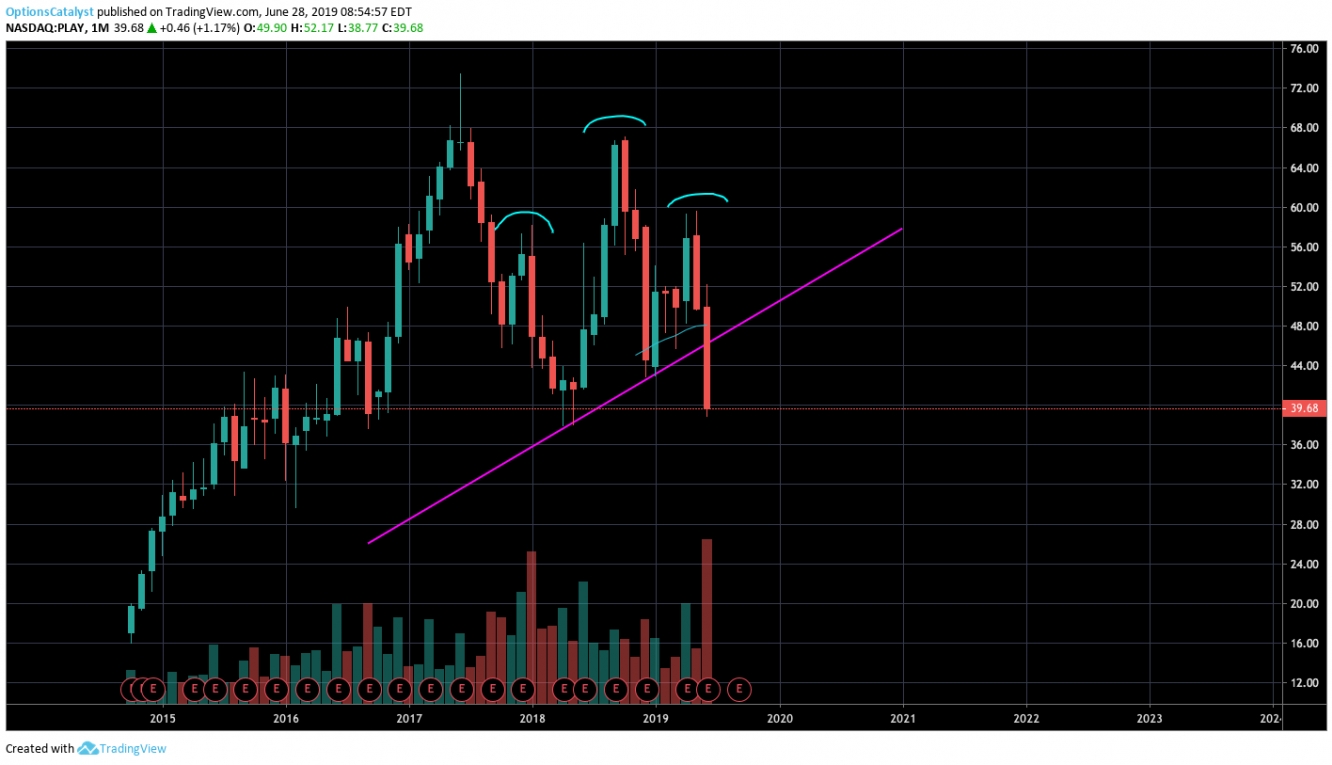
To get an idea on how one might trade this pattern, let’s take a look at Dave & Busters (NASDAQ:PLAY), an options trade that netted over 2000% for us earlier this month.

Dave & Buster’s Entertainment

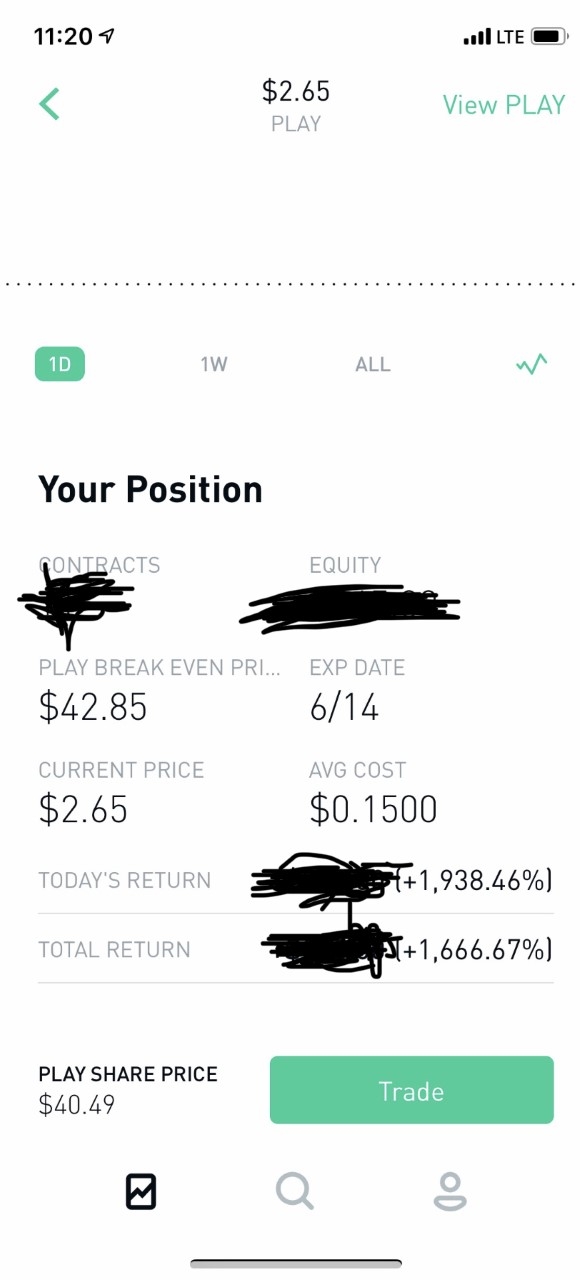
We took puts at .15/contract on 6/11 prior to earnings that afternoon. Subsequently, the stock went down over 20% and our puts skyrocketed to $3/contract. This is a great example of how a combination of a catalyst such as earnings, a perfect pattern setup, and a not so innovative company can net huge returns by purchasing put options (playing the stock to go down).

Playing The Stock To Go Down


Nike is a great company, but I will be waiting patiently to make a play down the line if this pattern plays out.

3rd party Ad. Not an offer or recommendation by Investing.com. See disclosure here or remove ads .

Latest comments

you don't even have a right shoulder and you're talking about a crash? LOL
Risk Disclosure: Trading in financial instruments and/or cryptocurrencies involves high risks including the risk of losing some, or all, of your investment amount, and may not be suitable for all investors. Prices of cryptocurrencies are extremely volatile and may be affected by external factors such as financial, regulatory or political events. Trading on margin increases the financial risks.
Before deciding to trade in financial instrument or cryptocurrencies you should be fully informed of the risks and costs associated with trading the financial markets, carefully consider your investment objectives, level of experience, and risk appetite, and seek professional advice where needed.
Fusion Media would like to remind you that the data contained in this website is not necessarily real-time nor accurate. The data and prices on the website are not necessarily provided by any market or exchange, but may be provided by market makers, and so prices may not be accurate and may differ from the actual price at any given market, meaning prices are indicative and not appropriate for trading purposes. Fusion Media and any provider of the data contained in this website will not accept liability for any loss or damage as a result of your trading, or your reliance on the information contained within this website.
It is prohibited to use, store, reproduce, display, modify, transmit or distribute the data contained in this website without the explicit prior written permission of Fusion Media and/or the data provider. All intellectual property rights are reserved by the providers and/or the exchange providing the data contained in this website.
Fusion Media may be compensated by the advertisers that appear on the website, based on your interaction with the advertisements or advertisers.
© 2007-2024 - Fusion Media Limited. All Rights Reserved.