Get 40% Off
👀 👁 🧿 All eyes on Biogen, up +4,56% after posting earnings. Our AI picked it in March 2024.
Which stocks will surge next?
Unlock AI-picked Stocks

Is Market Due For A Correction?

Published 05/05/2021, 02:40 PM
Updated 07/09/2023, 06:31 AM

Long-term, the stock market is in an uptrend but extended as noted in the chart below, which goes back to 2008. Note how every major pullback has occurred when the index has reached the top of its up-trending channel. I have notated these tops with a red box. This does not mean that the market can’t continue to advance despite being extended. It is just that the odds of some type of consolidation or pullback are elevated.
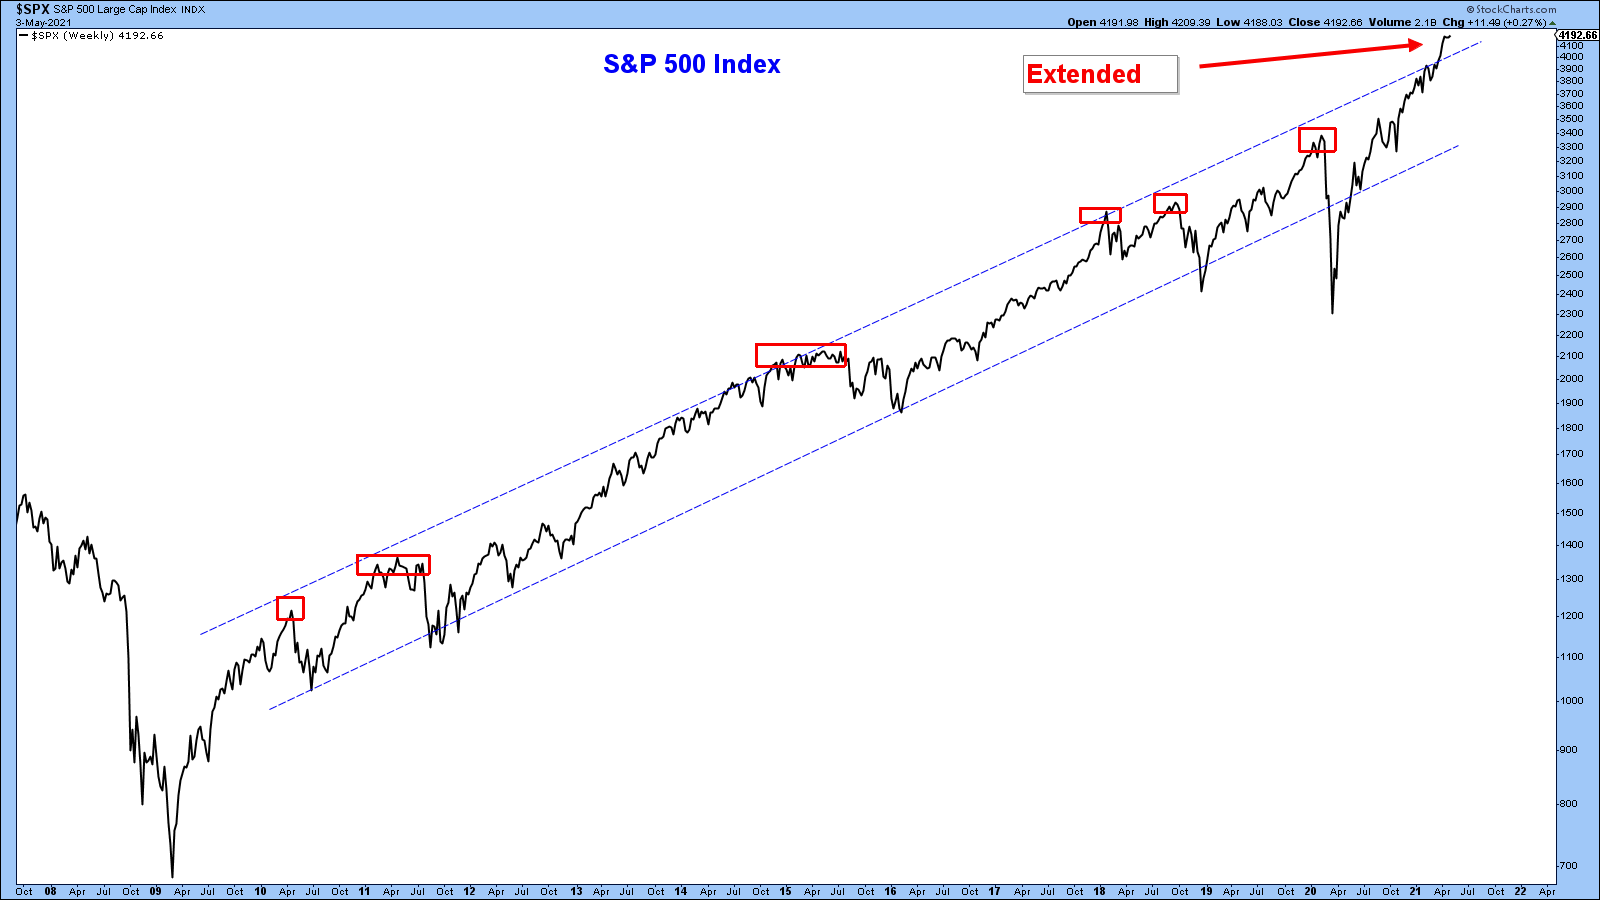
S&P 500 Weekly Chart.

Below is a short-term chart of the S&P 500 Index. Notice how the index has been consolidating over the past couple of weeks. It is logical that the market would consolidate here given it is extended.
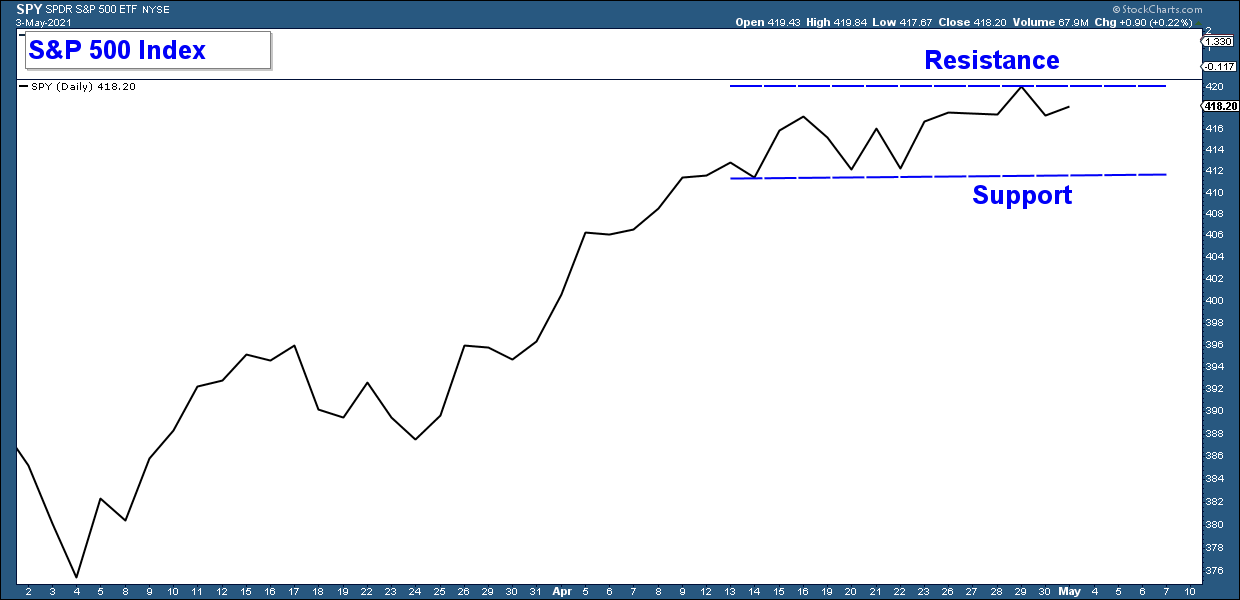
S&P 500 Daily Chart.

The Nasdaq 100 Index is also consolidating between support and resistance.
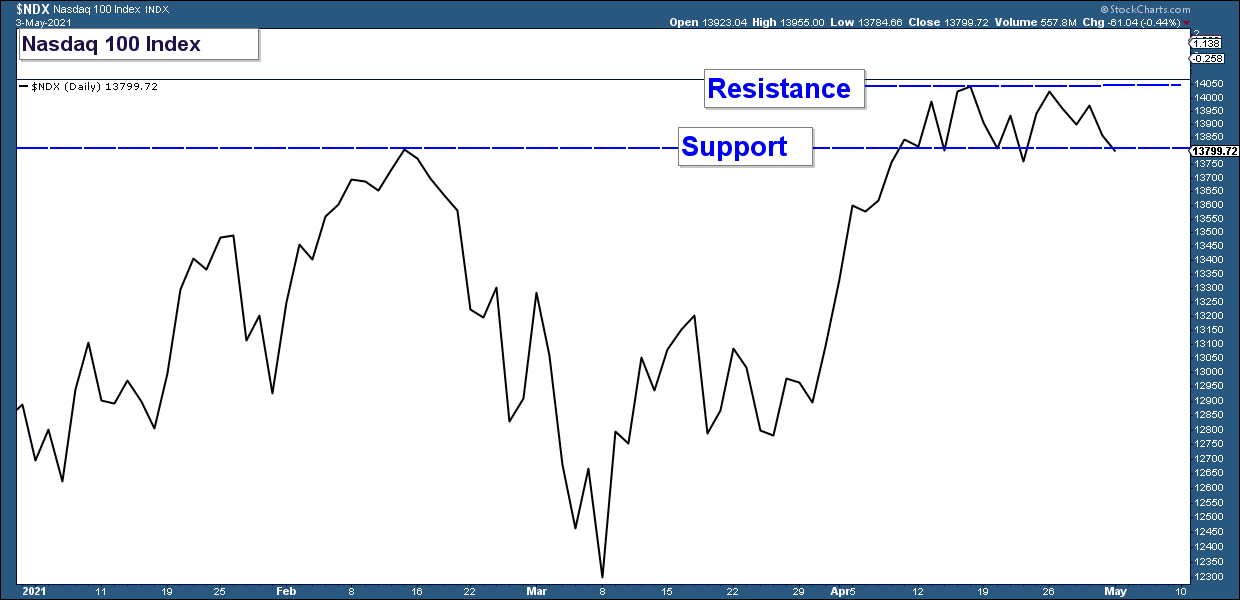
NASDAQ 100 Daily Chart.

If the market is going to advance despite being overbought, I would expect Small Cap stocks to lead the charge given they have been consolidating for the past three months and are not as overbought as the S&P 500.

That has not happened yet. And as you can see in the chart below, Small Caps (iShares Russell 2000 ETF (NYSE:IWM)) continue to consolidate.
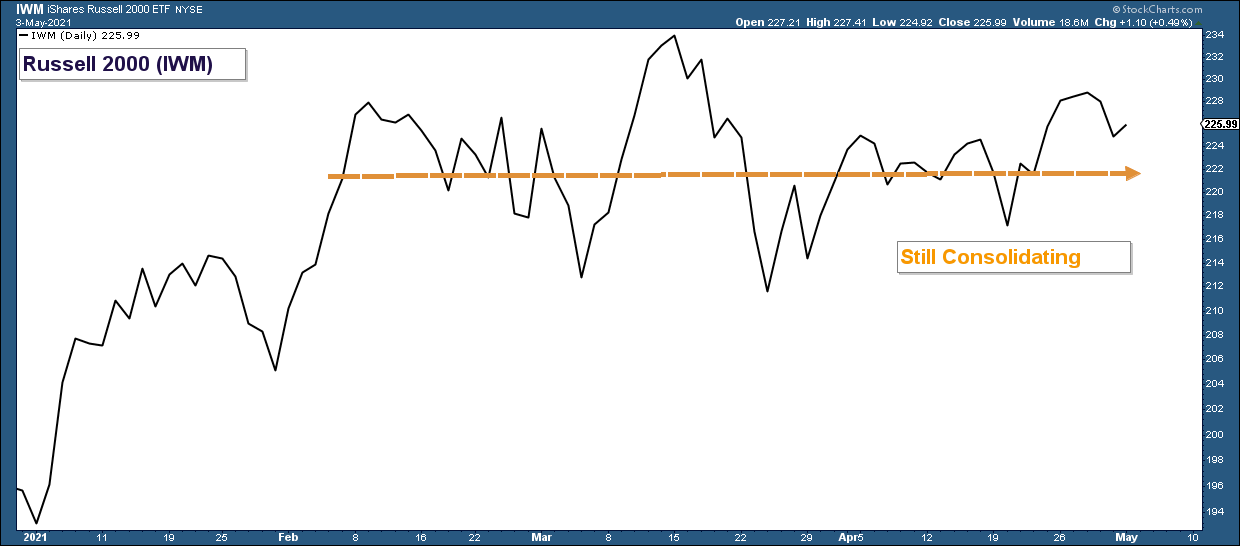
IWM Daily Chart.

The Bottom Line

Long-term, the market is in a confirmed uptrend. However, short-term it is extended to the upside. As a result, the market may have trouble advancing strongly in the near term without more consolidation or a pullback.

Other technicals also suggest short-term caution such as the VIX, which has started to become positively correlated with the market and is starting to rise. Historically, when I have seen the VIX behave in this manner it has frequently been a precursor to a market pullback or correction.

3rd party Ad. Not an offer or recommendation by Investing.com. See disclosure here or remove ads .

Also, momentum indicators have been negatively diverging with the market, suggesting an increase in the odds of a near-term pullback in stocks.

One of the main things that I will be watching in the coming weeks is whether the market can advance above resistance. If it can, that would be a strong signal that the broader market is poised for another leg higher. I think this is the lower-odds scenario.

On the other hand, if these major market indexes all begin to fall below their respective levels of support, I believe that would encourage more selling and be a signal that a short-term correction could be at hand.

Latest comments

the line of the up tr ending channel only joins 2 peaks. not sure what are you trying to draw
The two lines in the first chart is a channel and brackets most of the price action. This allows me to evaluate historical oversold and overbought levels over the long-term. This is somewhat different than a trendline where you would need at least three touches to form the line. Good luck in your trading!! Craig
hello
50% correction coming. any negative catalyst will spark this. fair value is around 19k
Did you short it already ?
no way just idle chit chat, from a watcher, defo not a trader.
 i sold my truck & mortgaged my house ... im short to the max.
Risk Disclosure: Trading in financial instruments and/or cryptocurrencies involves high risks including the risk of losing some, or all, of your investment amount, and may not be suitable for all investors. Prices of cryptocurrencies are extremely volatile and may be affected by external factors such as financial, regulatory or political events. Trading on margin increases the financial risks.
Before deciding to trade in financial instrument or cryptocurrencies you should be fully informed of the risks and costs associated with trading the financial markets, carefully consider your investment objectives, level of experience, and risk appetite, and seek professional advice where needed.
Fusion Media would like to remind you that the data contained in this website is not necessarily real-time nor accurate. The data and prices on the website are not necessarily provided by any market or exchange, but may be provided by market makers, and so prices may not be accurate and may differ from the actual price at any given market, meaning prices are indicative and not appropriate for trading purposes. Fusion Media and any provider of the data contained in this website will not accept liability for any loss or damage as a result of your trading, or your reliance on the information contained within this website.
It is prohibited to use, store, reproduce, display, modify, transmit or distribute the data contained in this website without the explicit prior written permission of Fusion Media and/or the data provider. All intellectual property rights are reserved by the providers and/or the exchange providing the data contained in this website.
Fusion Media may be compensated by the advertisers that appear on the website, based on your interaction with the advertisements or advertisers.
© 2007-2024 - Fusion Media Limited. All Rights Reserved.