Micron shares surge amid sharply higher revenue forecasts on AI-led memory demand
It has been a really wild ride for investors. The Dow Jones Industrial Average, the S&P 500 and the Nasdaq 100 Futures have all gone through one big rollercoaster ride. While volatility hurts the portfolio of investors, they are great for traders. That's because traders thrive on volatility. The Dow has gone back up above 25000 after falling to as low as 23088. The S&P 500 has regained quite a lot of its losses and the Nasdaq 100 which is the strongest of the 3 have managed to climb back up to almost 6900 a few days ago.
So is this rally a brand new uptrend that will help send the stock market to record highs again? Or is this just a dead cat bounce that brings a slight relief to investor's portfolio but will eventually cause another selling. There is some fear that the markets may form a lower high and proceeded to sell off again. One of the definitions of a trend change is the stock market failing to make a higher high but makes a lower high. If that happens, then we will enter into a new downtrend in the stock market.
Let us not speculate but learn to read what the charts are telling us. In times of volatility and uncertainty, we need to step back a bit and look at the big picture. I believe charts help us to do that.
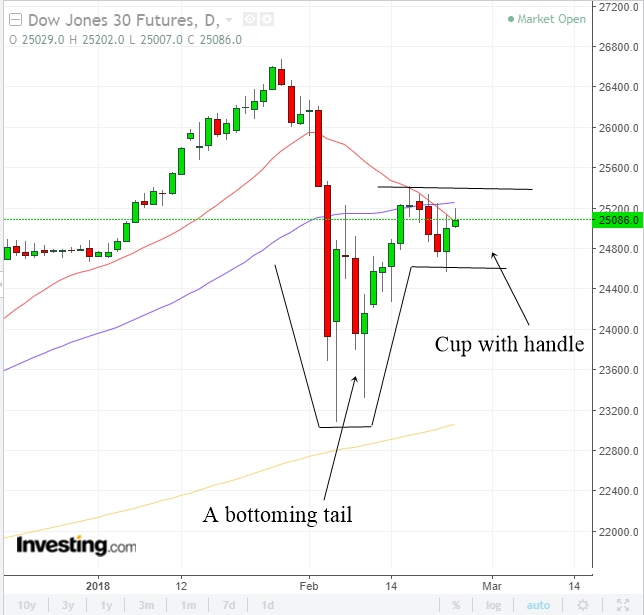
The chart above shows the daily chart of the Dow Jones Futures. As you can see, the selling ended with a bottoming tail which is one of the greatest bullish reversal candlestick patterns you can find. After the appearance of the bottoming tail, the Dow proceeded to move higher and made the biggest weekly gain since 2013. Impressive isn't it how a bullish candlestick can help to send Dow higher.
Dow has corrected a bit since the highs made last week. At this moment, it is just meandering in a trading range from around 24550 to 25400 which is quite a big trading range. However, when you look at it from the context of the big picture, the trading range looks like the handle of the cup with handle pattern.
The cup with handle pattern is a popular pattern that was popularized by William O' Neil in his book How To Make Money In Stocks. In his book, O'Neil stated that many of the biggest winners in the stock market happen right after the appearance of the cup with handle pattern in the stock chart. If Dow is in the process of forming a cup with handle pattern, then this is good news for investors. The breakout above the handle might help to send Dow climbing up to make fresh record highs.
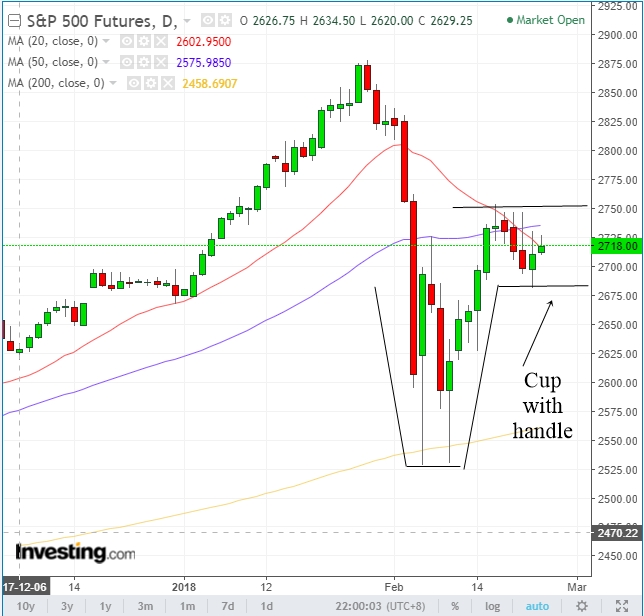
The chart above shows the daily chart of the S&P 500 Futures. It looks almost the same as Dow. Right now, both of these indexes are trading sideways forming a handle. If both of them can break out above the handle which I have drawn, then the stock market is likely to continue moving higher.


