A wobbly equity market, expectations for higher interest rates and weaker economic growth in the first quarter have inspired some pundits to claim that bear-market risk for stocks has spiked higher in recent weeks. Perhaps, but there’s still room for debate, based on a review of key indicators.
Let’s start with the economy. Last week’s preliminary GDP report for Q1 revealed a slowdown in growth. Output increased 2.3% during the January-through-March period, the government reported on Friday – the softest gain in a year. The deceleration could be a sign that the macro trend is weakening, although the dip might be another case of a Q1 soft patch that gives way to a rebound later in the year – a scenario that describes economic activity in recent years.
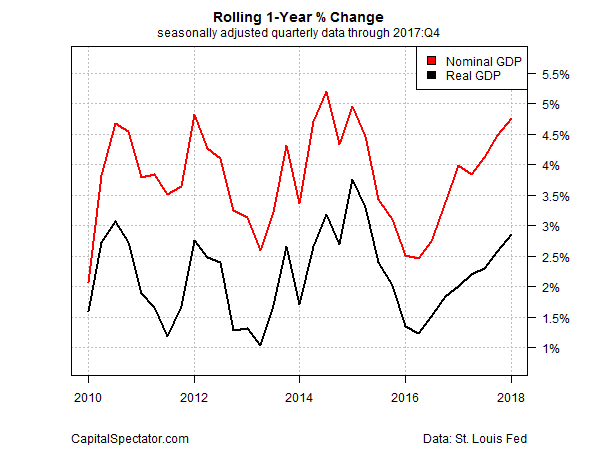
One reason for thinking that a repeat performance may be in the works: the year-over-year trend in GDP, in contrast with the quarterly data cited above, continued to accelerate in the first quarter. Real economic activity increased 2.9%, marking yet another improvement that lifted growth to its strongest pace in nearly three years. If the annual pace of output offers a more reliable signal for the economy by minimizing short-term noise, the latest GDP data offers a clue for expecting that the expansion will roll on at a healthy clip for the near term.
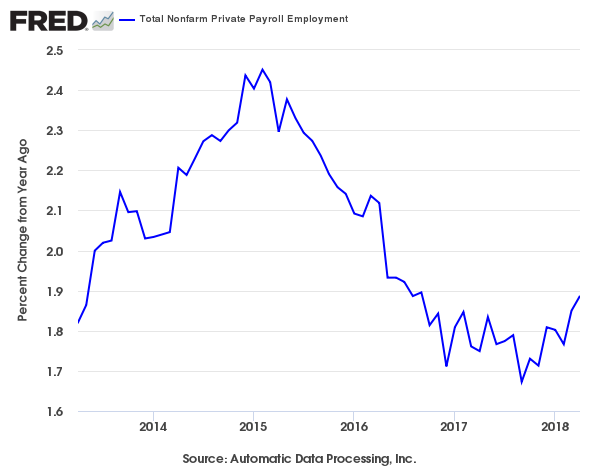
Yesterday’s ADP Employment Report offers positive data too. US companies hired 204,000 workers last month. The gain translates into a faster year-over-year trend: +1.9%, which is the strongest annual increase since September 2016. The upbeat news suggests that tomorrow’s payrolls update from the Labor Department will also deliver positive numbers. If so, the case will strengthen for expecting economic activity to perk up in the months ahead relative to Q1.
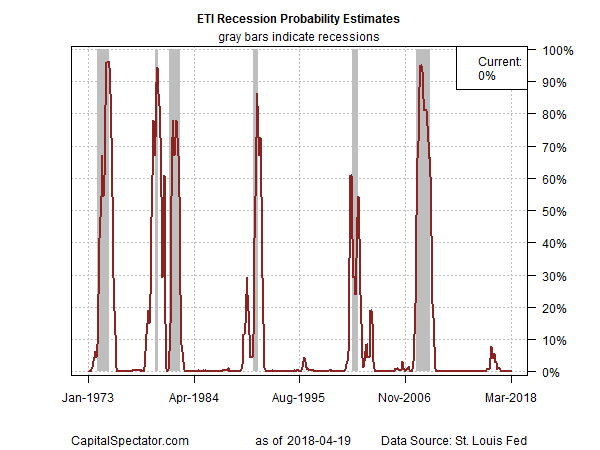
Meantime, a broad reading of economic numbers continues to show that recession risk is low. As reported in last month’s profile of the US business cycle, the odds that an NBER-defined downturn has started remain virtually nil through last month.
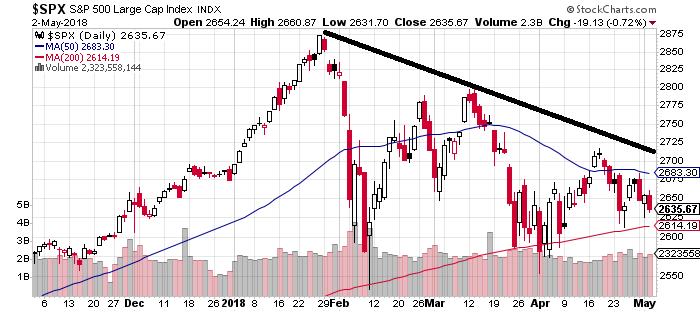
Sharp downturns in the stock market can occur outside of recession periods, of course. But the downside risk for equities will be limited if the economy is growing. Nonetheless, analysts point out that the S&P 500 Index’s upside trend is showing signs of breaking down this year. Notably, the high points in recent rallies reflect a downward bias and the lows for the S&P have more or less bounced off the widely followed 200-day moving average. A key question for the days ahead: Will the 200-day average continue to be a floor for the S&P? We may find out soon as the index appears set to retest that level for the third time this year.
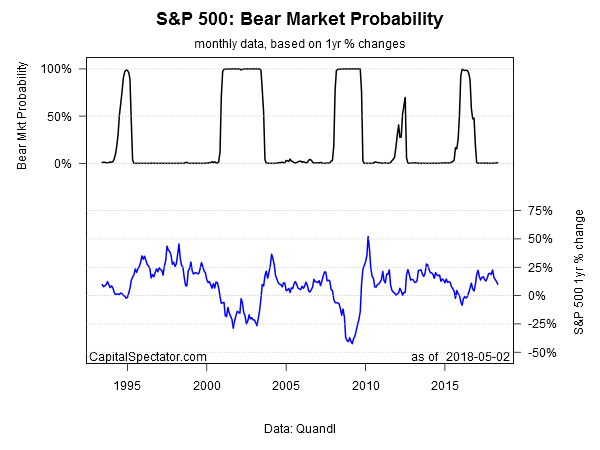
Meantime, an econometric estimate of bear-market risk indicates that the bull is still intact. Using a Hidden Markov model (see this post for a profile) to estimate the probability that a new downturn has started suggests that it’s premature to declare the bull regime dead and buried. That could change quickly, of course, depending on what unfolds next. But using the latest estimate has yet to raise a clear bear-market warning.
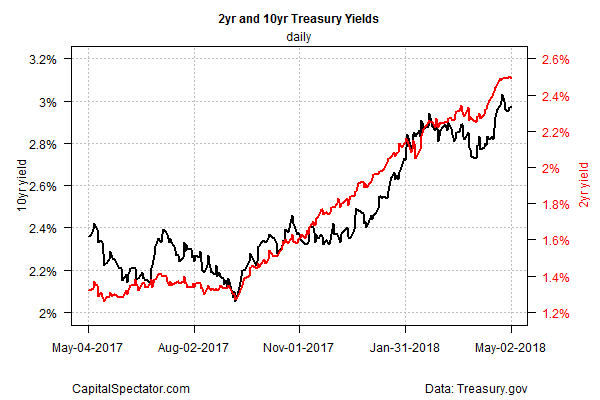
The bears counter that rising interest rates pose a threat for stocks. True, but it’s not yet obvious that the rise in rates has reached a critical level for equities in the immediate future. Bill Gross, an influential bond fund manager, tells Bloomberg that he expects rates to tread water for the near term. “I would expect the 10-year to basically meander around 2.80% to perhaps 3.10% or 3.15% for the balance of the year. It’s a hibernating bear market [for bonds], which means the bear is awake but not really growling.”
None of this means that the stock market is destined to rebound or even hold steady. But for the moment the numbers above provide a counterpoint to analysts who insist that an extended downturn for equities is a fait accompli.
Granted, the prospects for a resumption of a roaring bull market don’t look compelling at this juncture. At the same time, the jury’s still out on whether an extended downturn is a high-probability threat. That opens the door for considering a third possibility: a range-bound market that churns to and fro but ultimately goes nowhere fast.
In fact, that’s a fair description of market action so far this year. Despite a spike in volatility in 2018, the S&P 500’s wild ride leaves it little changed since the start of the year. As of last night’s close, the index is down a mild 1.4% year to date. By that measure, the year so far is mostly a yawn for stocks.
