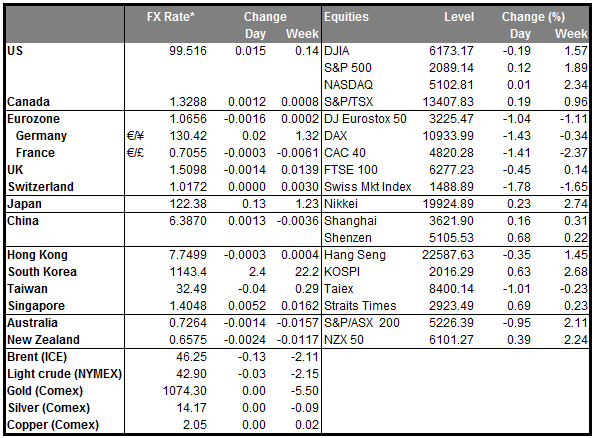
• Iran demands oil payments in euros Iran seeks to recover billions of dollars it is owed by other countries in euros. Following the removal of sanctions earlier last month, the country will also charge in euros for its recently signed oil contracts. Europe has become one of Iran’s main trading partners lately, as Iranian oil companies have rushed to recover the market share they held in the continent prior to the imposition of sanctions. Given this relationship, switching the sales to EUR will lower the transaction costs between Iranian oil producers and European firms. It could also increase the demand for the common currency, as countries like India will now be required to buy euros in order to repay previous debt, or to finance new orders.
• US jobs report brings a Fed hike back into play The US employment report showed that NFP increased by 151k in January, down from a revised 262k in December. However, the overall report signaled good news for the Fed, as the unemployment rate fell and average hourly earnings accelerated on a monthly basis. What is more, the participation rate ticked up, which confirms Chair Yellen’s argument that an improving jobs market will attract back people who stopped looking for employment. The positive report could increase the probability for a Fed hike in coming months, something that investors began to seriously doubt following comments from Fed officials on the impact of the global turmoil on the US economy. The Fed has one more employment report to consider before it gathers to decide on interest rates in March. If the labor market continues to post significant gains, and Fed officials refrain from making any new dovish comments on the downside risks posed from the global economy, we could see expectations of more rate hikes this year coming forward.
• Today’s highlights: During the European trading session, Canada’s building permits for December are coming out, and the forecast is for a rise after a collapse in November. A rebound in building permits could support CAD a bit, at least at the release.
• As for the rest of the week, on Tuesday, we have a light calendar day with no major events or indicators.
• On Wednesday, all the lights will fall on Fed Chair Yellen who delivers her semi-annual testimony on monetary policy before Congress. She will repeat the testimony to the Senate the following day. We will listen carefully to any comments on what to expect from the Fed this year. We got an idea earlier last week when Fed officials Fischer and Dudley stated that the FOMC will consider the impact of international developments on the US economy before deciding on interest rates. Based on these comments, the market scaled back its expectations for a March action. Therefore, it would be interesting to see if Yellen adopts the same view. If so, this could wipe out any hopes left and could bring the greenback under renewed selling pressure.
• In Norway, the CPI rate for January is expected to have hit the Norges Bank target of 2.5% yoy from 2.3% yoy previously.
• From the UK, we get the industrial output for December and expectations are for the figure to have fallen again, but at a slower pace than in the previous month. This will be an additional piece of information on how the British economy performed in Q4. In its calculation for the nation’s 1st estimate of Q4 GDP, the ONS reported that IP declined 0.2% mom in December, although the overall output had accelerated somewhat. A more-than-expected decline in Wednesday’s figure could raise some concerns for a downside revision in the 2nd estimate of GDP, which comes out on the 25th of the month.
• On Thursday, the Riksbank gathers to decide on its monetary policy meeting. On the 4th of January, the Bank held an extraordinary policy meeting where the Governor and Deputy Governor were granted powers to intervene in the currency market to safeguard the upturn of inflation from a possible rapid appreciation of the krona. However, the Deputy Governor expressed his opposition to the decision, supporting that currency interventions would require action over a long period to have clear impact on the exchange rate. We agree with him as something like that could hurt the Bank’s balance sheet and equity. After all, the krona is not strong enough to pound the alarm for currency intervention. This could happen if the currency appreciates too quickly. In the prospect of further action by the ECB in March, we believe that the Swedish central bank will try to offset any possible action from the ECB either by reducing the repo rate or extending its QE program.
• On Friday, we get the preliminary GDP data for Q4 from Germany and Eurozone as a whole. Both the figures are expected to show that the two economies grew at the same pace as in Q3. Since Germany, Europe’s growth engine, will release its GDP estimate ahead of Eurozone, investors will be monitoring it as a gauge for any possible surprise in the bloc’s print. Germany has already released a full-year estimate of its 2015 GDP, on which we suppose Friday’s forecast is based. As a result we don’t expect any surprise, at least in the German data. As for the Euro-area, the fall in global demand, warmer weather and the Paris terror attacks may have all weighed on economic growth. However, these could have been offset from falling unemployment, lower energy prices boosting real incomes, and a large increase in public spending as a result of the huge migrant influx. As a result, we don’t see the possibility for a surprise here either and we believe that the reaction on the euro would be limited.
• In the US, the main event will be retail sales for January. Both the headline and the core figures are expected to have risen after falling in December. In January, the labour market continued to tighten, energy prices fell further and cold weather across the country may have boosted the sales of clothing. As such, a rebound in retail sales seems very likely and could support the dollar at least for a while.
The Market
EUR/USD tumbles following the US employment report
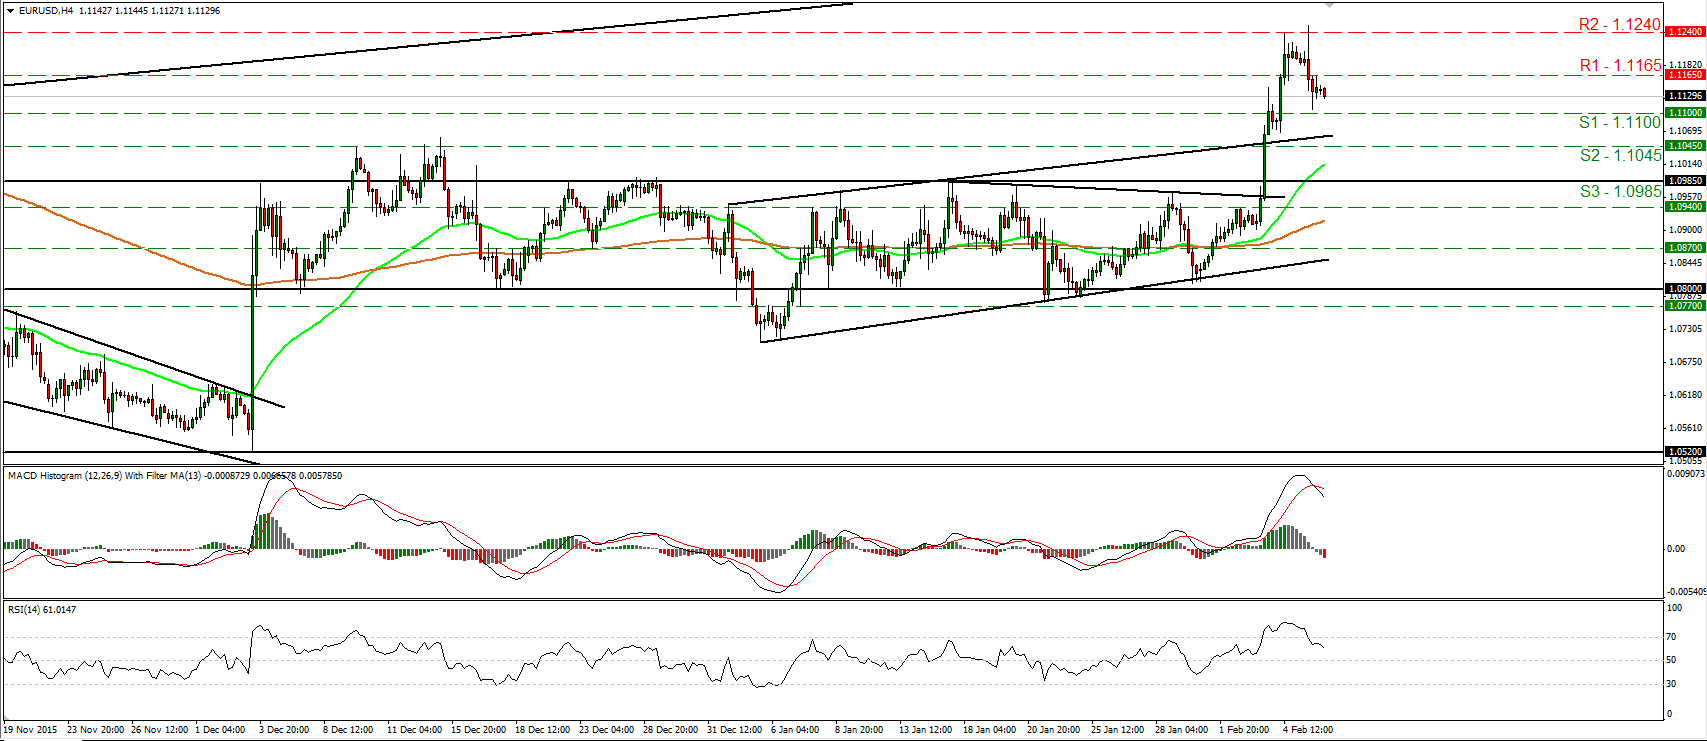
• EUR/USD retreated on Friday after the US employment report showed that the unemployment rate dipped to an 8-year low of 4.9%, while average hourly earnings were up 2.5% yoy. The rate slid following the report and hit support slightly above the 1.1100 (S1) line. During the early European morning Monday, the pair looks to be headed for another test at that barrier, where a clear and decisive dip is likely to pave the way towards our next support line of 1.1045 (S2). Our short-term oscillators support that EUR/USD is poised to continue lower. The RSI exited its overbought territory and now it points south, while the MACD, although positive, has topped and fallen below its trigger line. However, although the pair is possible to continue falling for a while, bearing in mind that on the 3rd of February the pair emerged above the 1.0985 (S3) hurdle, which is the upper bound of the sideways range it had been trading recently, I would consider the short-term outlook to be to be cautiously the upside. I would treat Friday’s retreat, or any extensions of it, as a corrective move for now. As for the bigger picture, as long as the rate is trading between the 1.0800 key zone and the psychological area of 1.1500, I would keep the view that the medium-term outlook stays flat.
• Support: 1.1100 (S1), 1.1045 (S2), 1.0985 (S3)
• Resistance: 1.1165 (R1), 1.1240 (R2), 1.1300 (R3)
GBP/JPY falls below 117.00
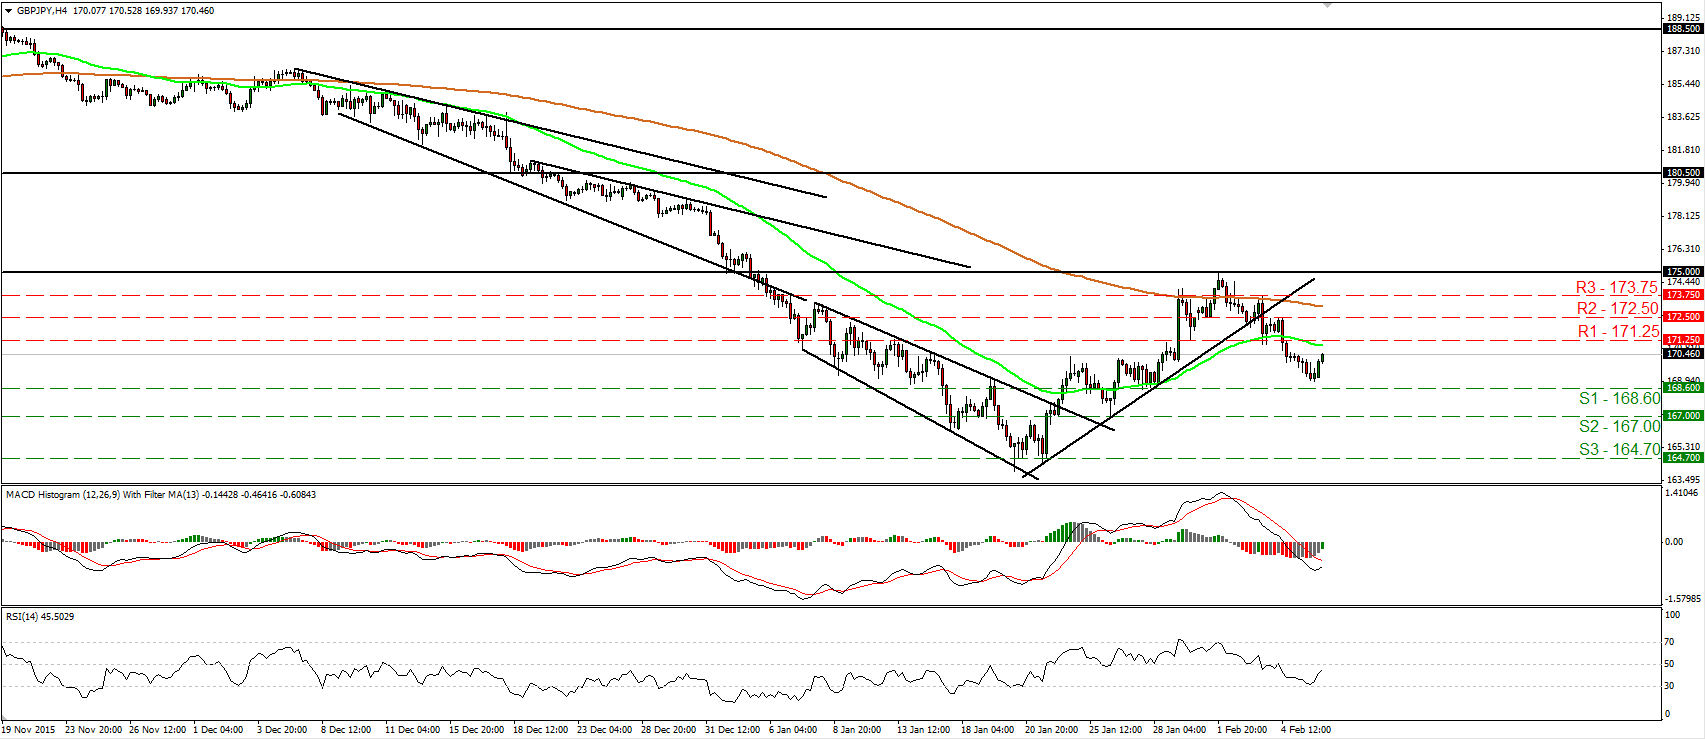
• GBP/JPY traded higher during the Asian day Monday, after it found support slightly above the 168.60 (S1) support barrier. Given that the rate started sliding after it hit the psychological zone of 175.00 and subsequently it fell below the uptrend line taken from the low of the 21st of January, I would consider the short-term outlook to be cautiously negative. Nevertheless, our momentum studies support that the current corrective rebound may continue for a while. The RSI rebounded from near its 30 line and is now headed towards its 50 line, while the MACD, although negative, has bottomed and could move above its signal line any time soon. A break above 171.25 (R1) is possible to confirm the continuation of the bounce and may initially target the next resistance of 172.50 (R2). Switching to the daily chart, the decline following the test at 175.00 could be a sign that the recovery started on the 20th of January was just a corrective move of the longer-term negative path.
• Support: 168.60 (S1), 167.00 (S2), 164.70 (S3)
• Resistance: 171.25 (R1), 172.50 (R2), 173.75 (R3)
AUD/USD slides and hits support at 0.7050
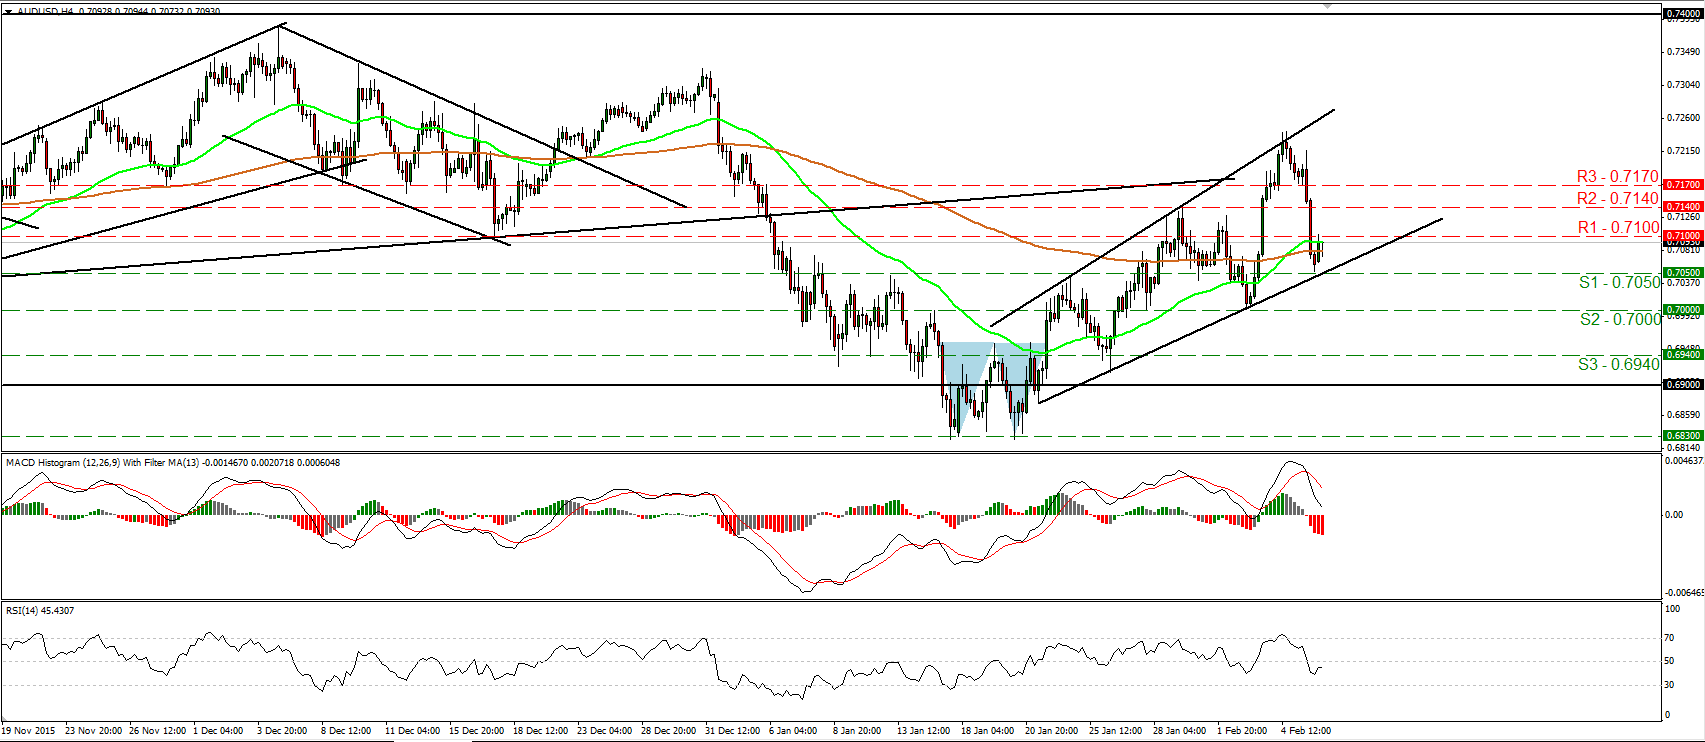
• AUD/USD tumbled on Friday following the US employment report. However, the rate found support at 0.7050 (S1), near the upside support line taken from the low of the 21st of January, and then it rebounded somewhat. Given that the rate rebounded from near the aforementioned upside line, I see the possibility for the rebound to continue for a while. A break above the resistance of 0.7100 (R1) is possible to open the way for the 0.7140 (R2) obstacle. Looking at our momentum indicators though, I see that the RSI stands below its 50 line and points sideways, while the MACD, although positive, stands below its trigger line and looks to be headed towards zero. These indicators give evidence of weakening momentum and show signs that the rate could turn down at some point in the near future and break below the 0.7050 (S1) line. Switching to the daily chart, I see that AUD/USD is still trading within the sideways range between 0.6900 and 0.7400. Therefore, I maintain my “wait and see” stance as far as the medium-term bias is concerned.
• Support: 0.7050 (S1), 0.7000 (S2), 0.6940 (S3)
• Resistance: 0.7100 (R1), 0.7140 (R2), 0.7170 (R3)
Gold emerges above 1162
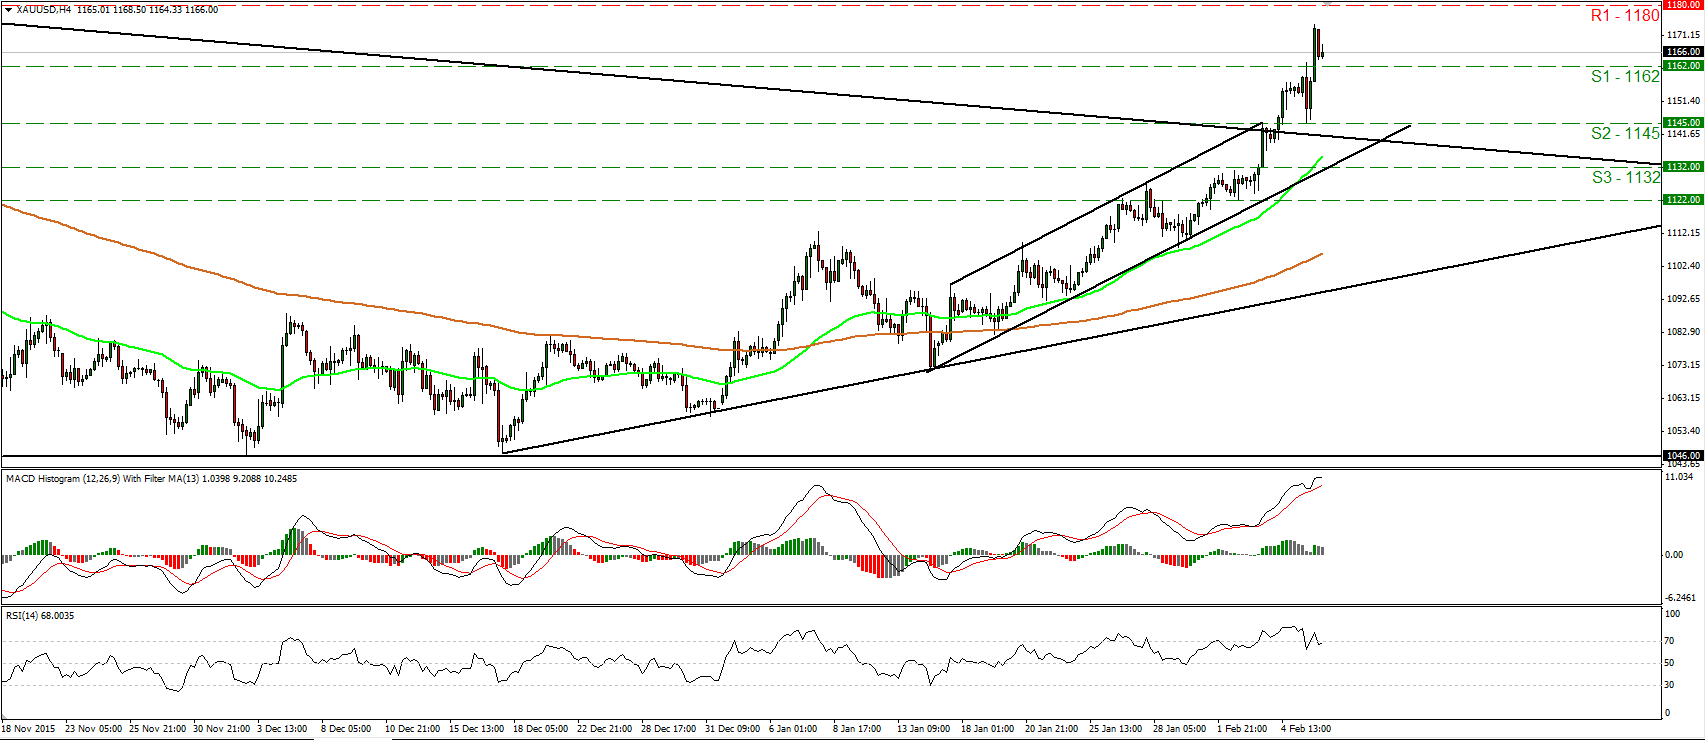
• Gold climbed higher on Friday, breaking above the resistance (now turned into support) line of 1162 (S1). However, the metal failed to reach the 1180 (R1) resistance line and pulled back to trade slightly above the aforementioned barrier. The price structure remains higher peaks and higher troughs above the short-term uptrend line taken from the low of the 14th of January and as a result, I still see a positive near-term outlook. I would expect buyers to take control again at some point and target the 1180 (R1) zone. A clear move above that resistance is possible to carry extensions towards the 1190 (R2) hurdle. Switching to the daily chart, I see that on the 4th of February, the price broke above the long-term downside resistance line taken from the peak of the 22nd of January 2015. As a result, I would consider the medium-term outlook to be positive as well.
• Support: 1162 (S1), 1145 (S2), 1132 (S3)
• Resistance: 1180 (R1), 1190 (R2), 1200 (R3)
DAX futures break below the key support zone of 9300
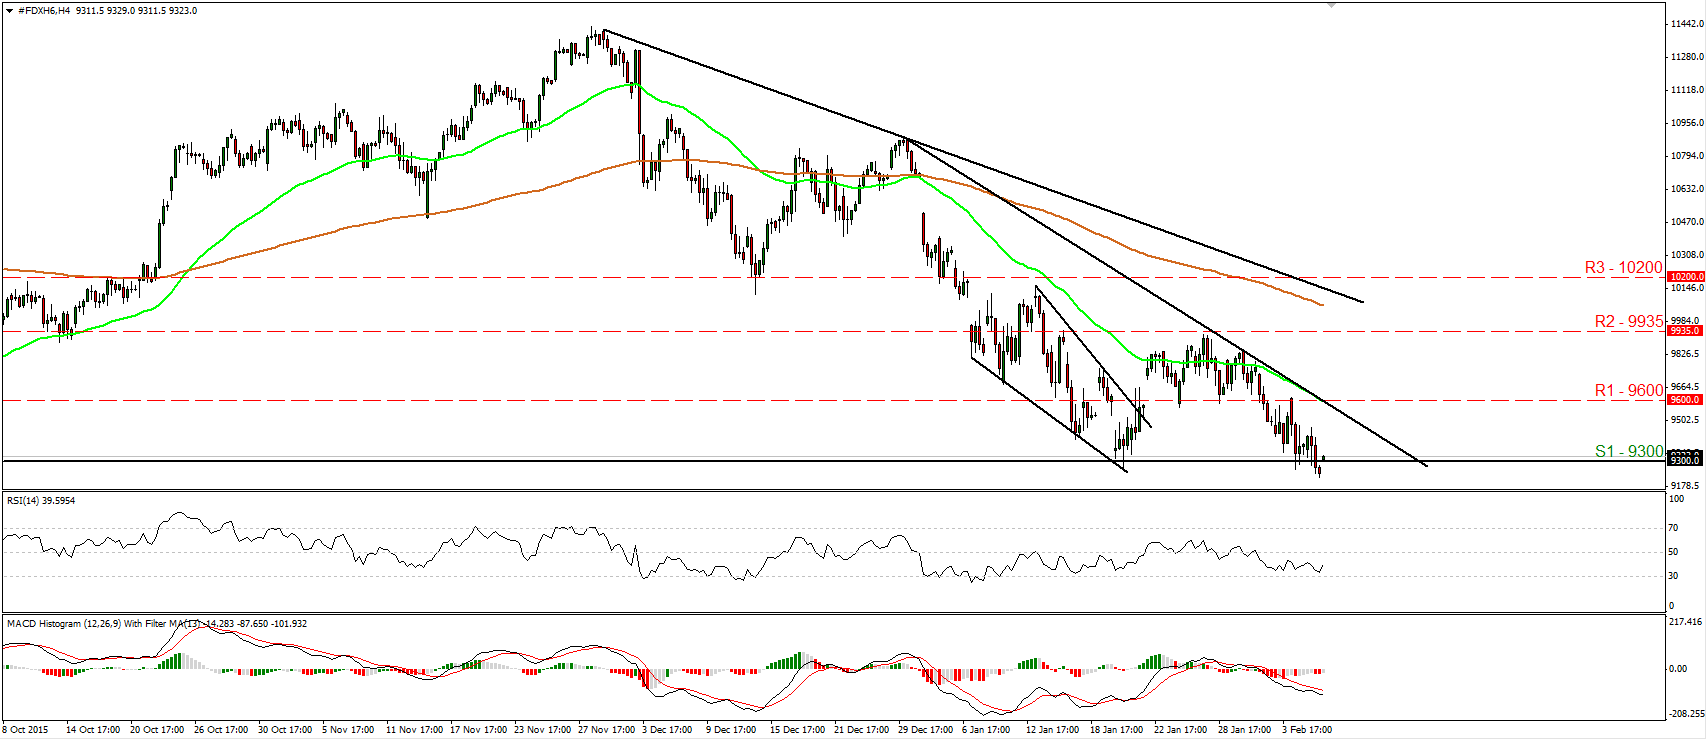
• DAX futures traded lower on Friday and dipped slightly below the key support zone of 9300 (S1). However, during the European morning, the index gapped back above that obstacle. Although the price structure suggests a short-term downtrend on the 4-hour chart, I see the possibility for an upside corrective bounce before the bears decide to pull the trigger again, Perhaps for another test near the resistance territory of 9600 (R1). This is also supported by our short-term oscillators. The RSI rebounded from near its 30 line and is now pointing up, while the MACD, although negative, shows signs that it could start bottoming. On the daily chart, I see that since the 1st of December the index has been printing lower peaks and lower troughs, something that keeps the longer-term picture negative.
• Support: 9300 (S1), 9100 (S2), 8900 (S3)
• Resistance: 9600 (R1), 9935 (R2), 10200 (R3)


