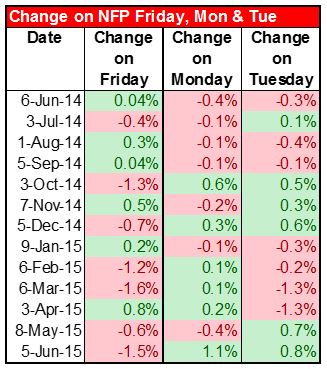
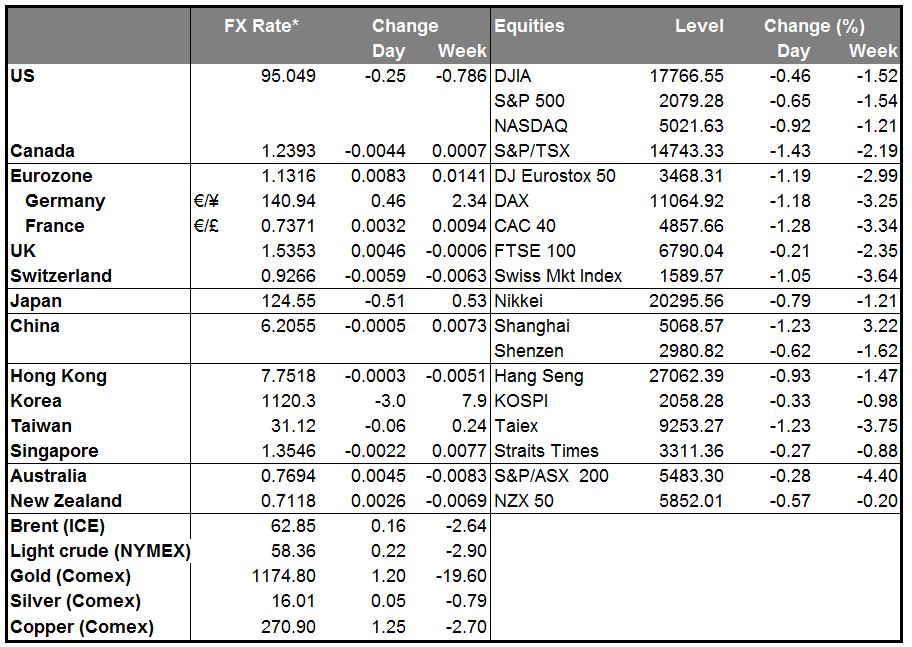
USD has the usual post-NFP reversal It’s the usual pattern. Over the last year (at least), whatever way EUR/USD has moved on payroll Friday, it’s reversed the movement the following Monday 9 times out of 12. So it shouldn’t have been a surprise when it did so again yesterday, filling the payroll gap and more. The trigger was apparently a statement by a French official that President Obama had criticized the strength of the dollar, but even though he quickly denied having said anything like that – and Italian PM Renzi confirmed that there were no big discussions about currencies – the dollar kept reversing. Probably the reason is interest rate differentials: 10-year Bund yields were up 3.5 bps yesterday even though the ECB has accelerated its purchase, while 10-year Treasury yields declined 2.5 bps and Fed funds expectations retreated 3.5 bps (although they are still both well above their pre-payroll levels). As a result, USD fell against all the G10 currencies yesterday. It’s now lower than it was before the payroll figure against EUR, GBP, CHF, CAD and SEK. It remains higher vs JPY, AUD, NZD and NOK.
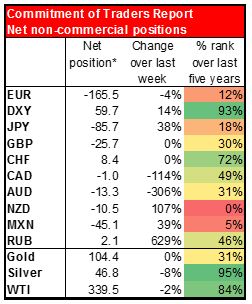
Personally, I think this reversal is overdone. I still think we are on schedule for the first Fed rate hike in September. However, there are a lot of wounded dollar bulls out there and it may take some time before confidence comes back. Friday’s Commitment of Traders (COT) report showed that investors had boosted their short EUR positions and increased their long DXY positions last week, so they may be reluctant to boost them any more for now. Moreover, as the table shows, the market’s pattern between post-NFP Monday and Tuesday is much less consistent than between Friday and Monday. While Monday reversed Friday’s move nine times out of the last 12, Tuesday’s move reversed Monday’s only six times – in other words, exactly what you would expect from a random pattern.
Nonetheless, we could see a rally today if the employment indices in the National Federation of Independent Businesses (NFIB) are positive and the JOLTS survey is good – two employment-related indicators coming out later today that may remind people that after Friday’s payroll figure, we are nearer to fulfilling half of the Fed’s mandate (see below). Still, the economic data from Germany and Japan is looking better too, so the argument for the dollar is not as one-sided as it was a few months ago.
TRY likely to remain weak One currency that didn’t gain vs USD yesterday was TRY, which fell nearly 5%. Although the trigger was of course the uncertainty caused by the ruling AK Party losing its majority in parliament, there are good reasons why TRY was likely to remain weak regardless (although maybe not that weak). These include: high inflation (8.1% yoy), an extremely wide current account deficit (forecast at -4.8% of GDP this year), a rapid build-up of private sector debt, and of course the expected start of a Fed tightening cycle, which is likely to drain funds from all EM countries and make it harder for Turkey to fund its current account deficit and repay its debt. I expect the currency to continue to lose ground vs USD and EUR as the political situation makes it even harder to deal with these economic problems.
Abe comments boost USD/JPY Although the dollar fell against JPY too yesterday, it fell relatively less after Japanese PM Abe said that a weaker yen has “a positive impact” on Japanese companies doing business overseas and helps attract tourists to Japan. “Generally, we think it is desirable to see the exchange rate be stable based upon economic fundamentals,” he said, which is the usual kind of meaningless comment that political figures make about the exchange rate. Basically they don’t like sudden movements in the exchange rate, but it appears to me that officialdom does not mind a gradual weakening in the currency to support Japanese exports.
China CPI slows more than expected Consumer prices rose only 1.2% yoy in May, down from 1.5% yoy in April, while producer prices fell faster than expected -- -4.6% instead of the expected -4.5%. In other words, no signs of any change in the disinflation picture in China. The low level of inflation reflects manufacturing overcapacity meeting weak demand – not a good prospect for AUD and NZD. That may be why those two have not regained their pre-payroll level. They are likely to remain relatively weak, in my view.
Today’s highlights: During the European day, Eurozone’s final GDP for Q1 is forecast to confirm the preliminary print and show a rise of 0.4% qoq.
In the UK, the trade deficit for April is forecast to narrow a bit to GBP 2.6bn from GBP 2.8bn the month before. This figure is not particularly market-affecting; over the last six months, the maximum impact on GBP/USD in the following hour was ±0.2%, with most instances not moving the pair more than ±0.1%. Most of the impact is in the first 10 minutes after the release.
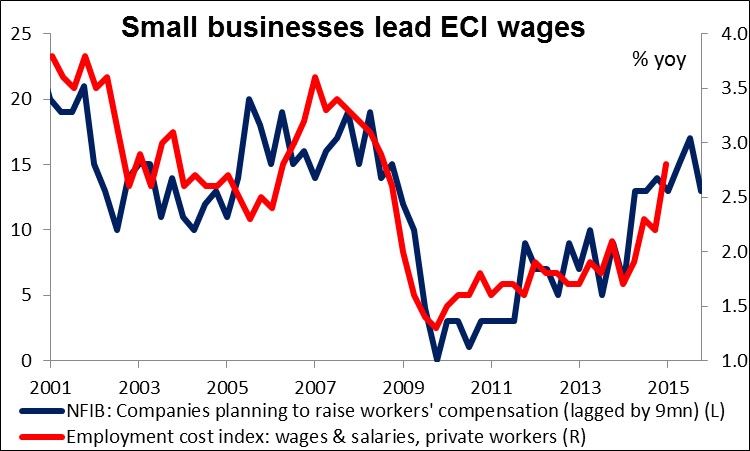
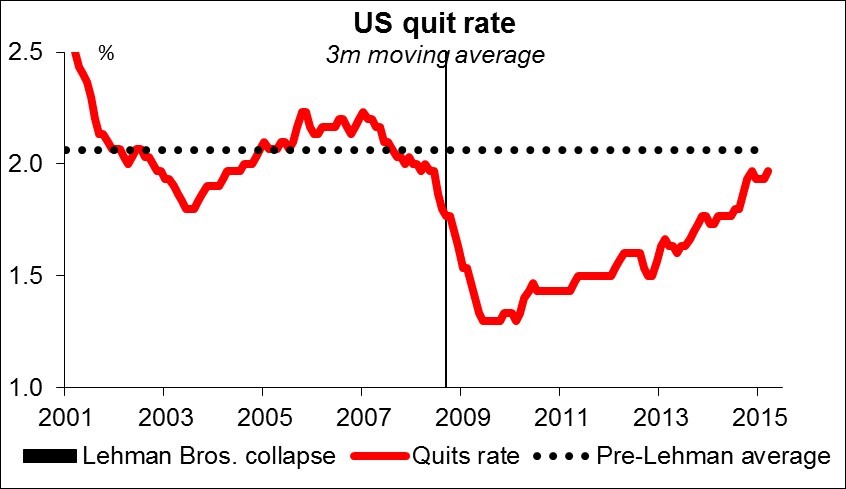
In the US, only data of secondary importance are coming out. The NFIB small business optimism for May is expected to have increased a bit. While this indicator is not particularly market-affecting, it’s well worth watching because of the Fed’s emphasis on employment. Small businesses employ the majority of people in the US, so this indicator’s sub-indices on employment are closely watched. For example, the “companies planning to raise workers' compensation” series is a fairly good leading indicator of the Employment Cost Index nine months later. The Job Opening and Labor Turnover Survey (JOLTS) report for April is also due out. Job openings are expected to have increased modestly to 5.044mn from 4.994mn the previous month. This survey will bring also the “quit rate,” a closely watched indicator of how strong the job market is. This indicator is slowly getting back to where it was before the Lehman Bros. collapse, which would signal that confidence in the job market was back to normal – a positive sign for the Fed. Wholesale inventories for April are also coming out.
As for the speakers, National Bank of Slovakia Governor and ECB Governing Council member Jozef Makuch speaks.
The Market
EUR/USD recovers the NFP losses
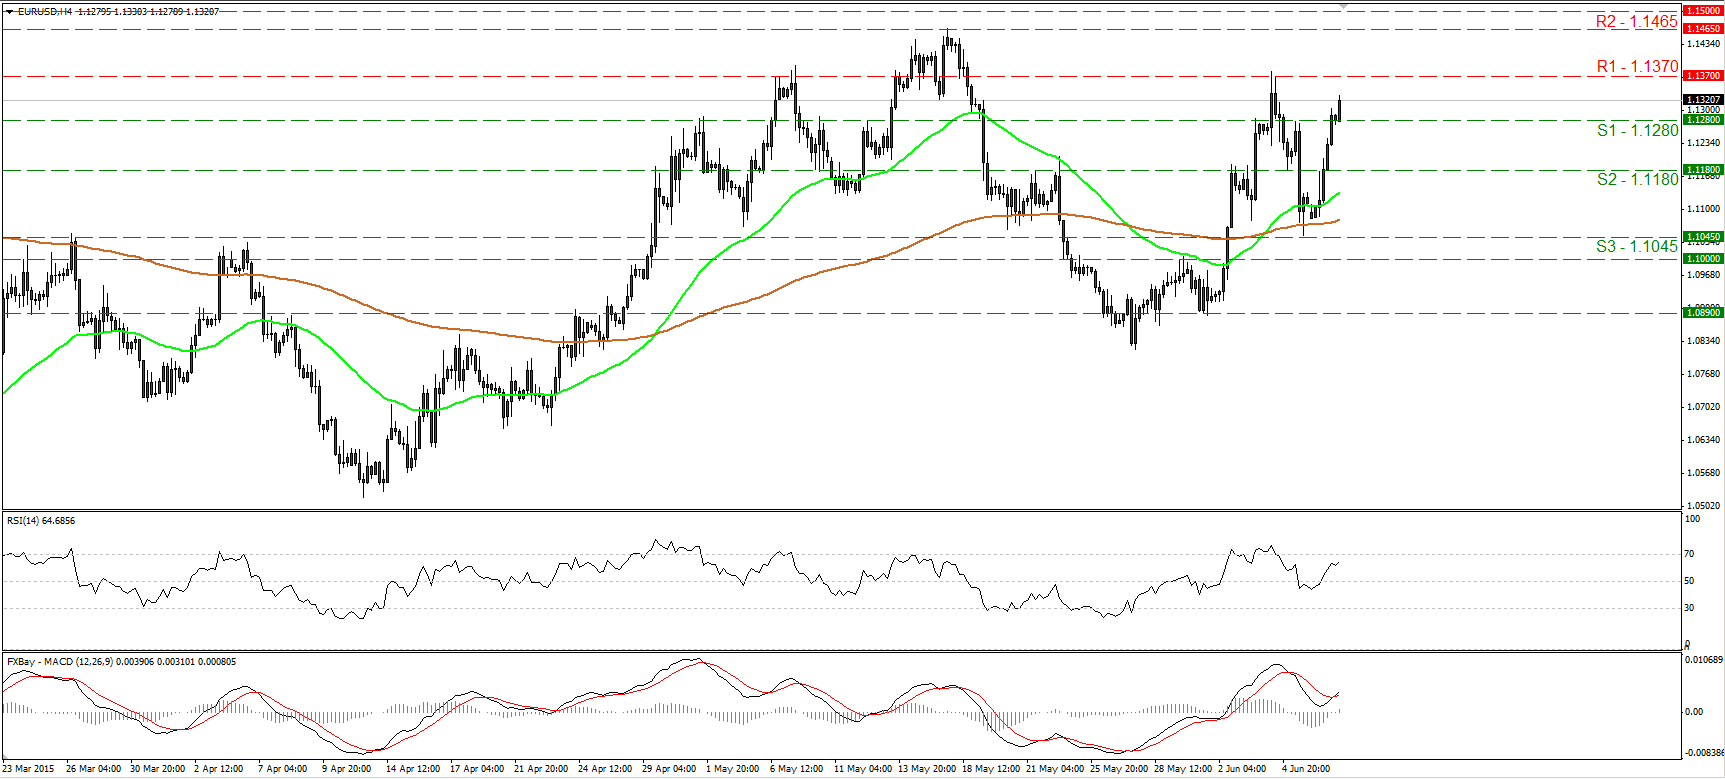
EUR/USD soared on Monday, recovering all the NFP losses and gaining even more. The pair emerged above the resistance (now turned into support) of 1.1280 (S1) and could now be headed towards 1.1370 (R1). A break above that line though is needed to confirm a forthcoming higher high on the 4-hour chart and perhaps turn the short-term picture to the upside. Such a move could prompt extensions towards our next resistance of 1.1465 (R2). Yesterday’s positive sentiment is printed on our momentum studies as well. The RSI is back above its 50 line is now headed towards its 70 line, while the MACD, already positive, has bottomed and moved above its trigger line. In the bigger picture, I believe that the move that could carry larger bullish implications is a clear close above the psychological zone of 1.1500 (R3).
• Support: 1.1280 (S1), 1.1180 (S2), 1.1045 (S3).
• Resistance: 1.1370 (R1), 1.1465 (R2), 1.1500 (R3).
EUR/GBP hits support at 0.7265 and shoots up
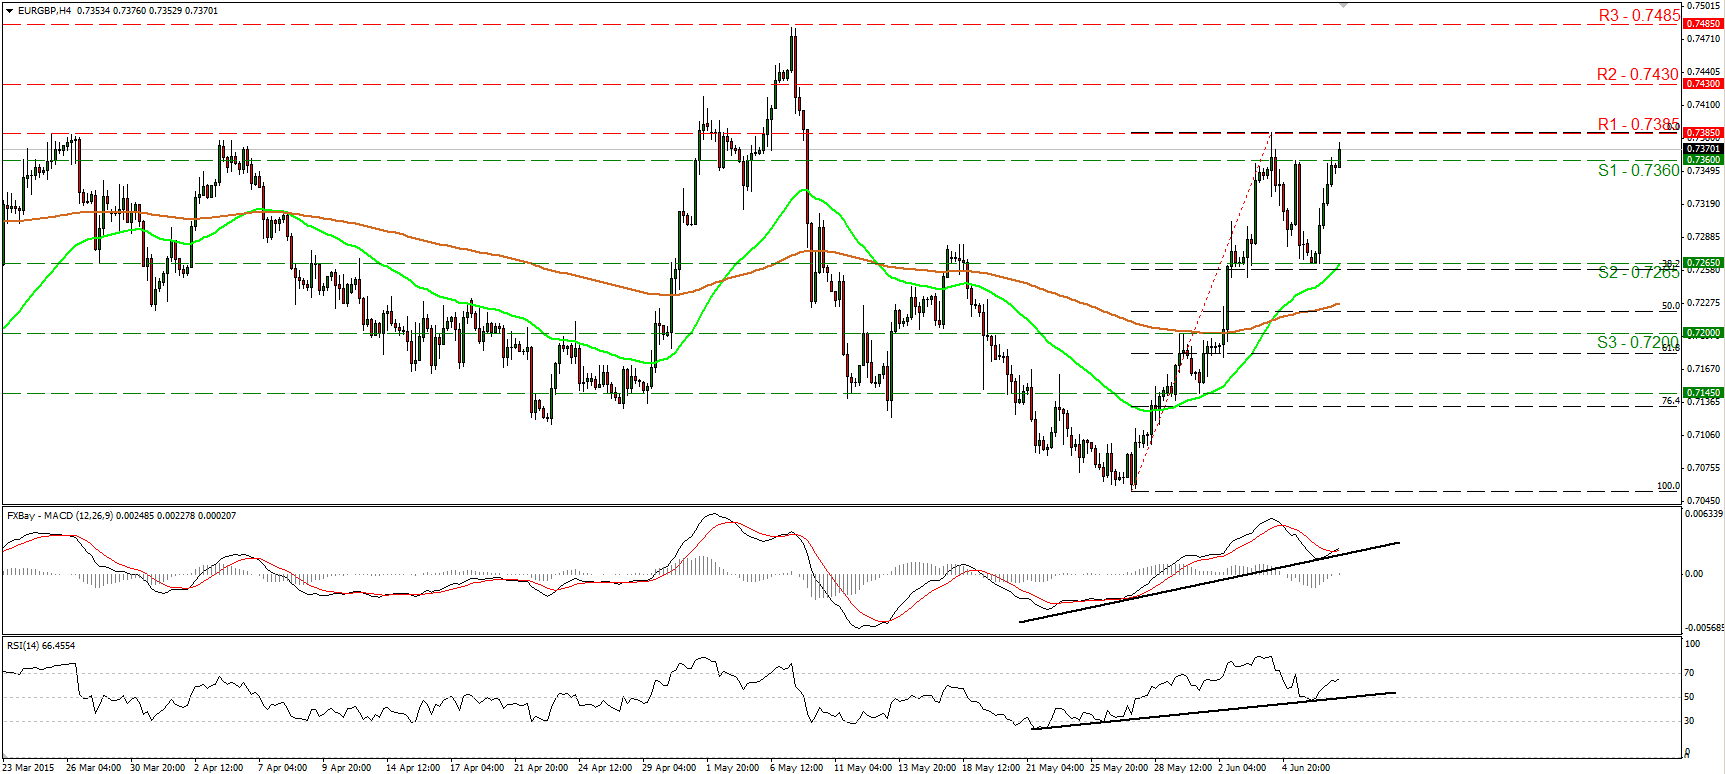
EUR/GBP jumped on Tuesday after hitting support at 0.7265 (S2), which stands slightly above the 38.2% retracement level of the 27th of May – 4th of June advance. The rate raced above the resistance (turned into support) of 0.7360 (S1) and now looks ready to challenge Thursday’s peak of 0.7385 (R1). A decisive break above that hurdle would confirm a forthcoming higher high and is likely to set the stage for extensions towards the next one at 0.7430 (R2). Our short-term oscillators detect strong upside speed and magnify the case that EUR/GBP could trade higher. The RSI rebounded from near its 50 line and is now headed towards its 70 line, while the MACD, already positive, has bottomed and poked its nose above its trigger line. On the daily chart, the pair has been trading in a non-trending mode since mid-March. Therefore, although I would expect some near-term advances, I would consider the overall outlook to be neutral.
• Support: 0.7360 (S1), 0.7265 (S2), 0.7200 (S3).
• Resistance: 0.7385 (R1) 0.7430 (R2), 0.7485 (R3).
AUD/USD rebounds from 0.7600
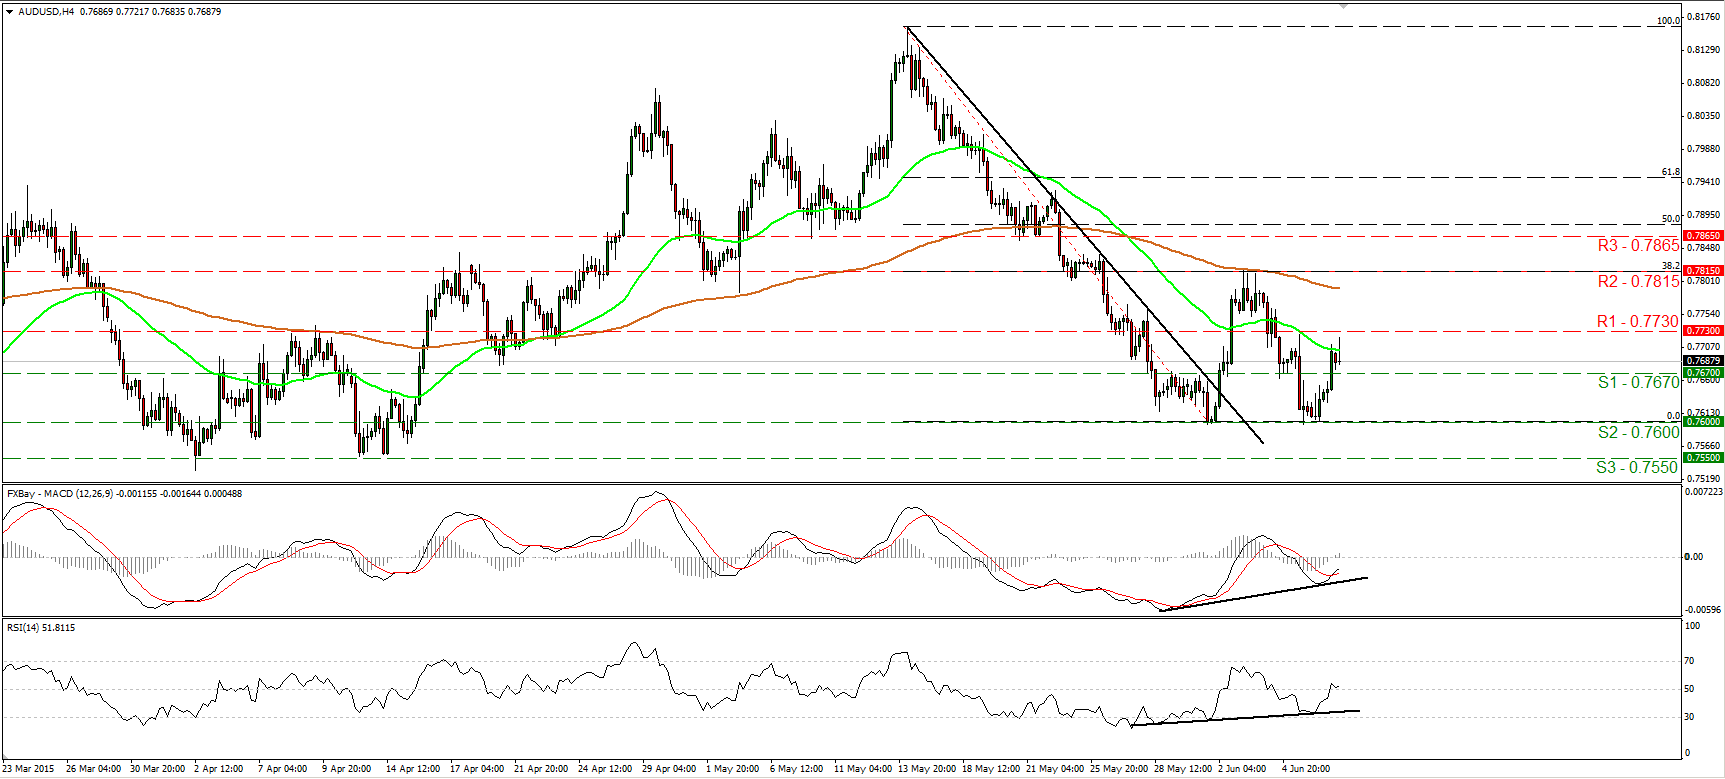
AUD/USD raced higher on Monday after hitting support at 0.7600 (S2). During the European morning Tuesday, the rate hit resistance slightly below 0.7730 (R1) and retreated somewhat. I would expect a clear move through that resistance to pull the trigger for the next one at 0.7815 (R2), which is defined by the peak of the 3rd of June and also happens to be the 38.2% retracement level of the 14th of May – 1st of June decline. Our momentum studies support further advances. The RSI looks able to rebound from its 50 line, while the MACD, although negative, has bottomed and crossed above its trigger line. There is also positive divergence between both these indicators and the price action. As for the broader trend, a clear close below the psychological zone of 0.7500 (S3) is the move that could trigger the resumption of the prevailing longer-term downtrend.
• Support: 0.7670 (S1), 0.7600 (S2), 0.7550 (S3).
• Resistance: 0.7730 (R1), 0.7815 (R2), 0.7865 (R3).
Gold trades virtually unchanged
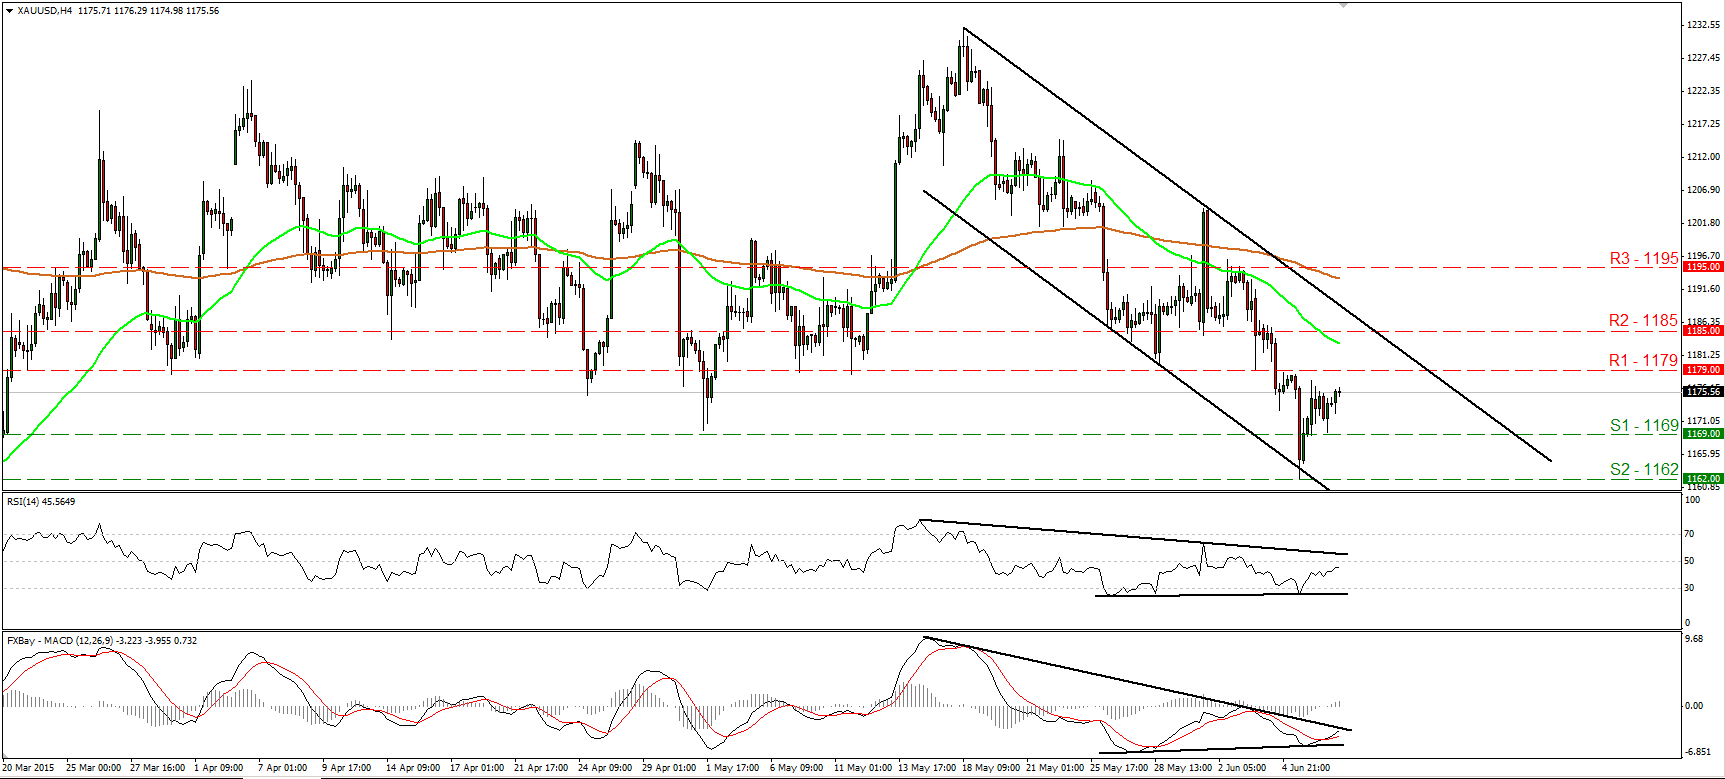
Gold slid on Monday, hit support at 1169 (S1), but then rebounded to trade virtually unchanged. During the early European morning Tuesday, the metal is trading below the resistance barrier of 1179 (R1), and although the short-term picture is negative, I see signs that we may experience further upside correction. The RSI raced higher and is now slightly below its 50 line, while the MACD has bottomed, crossed above its trigger line, and points north. There is still positive divergence between both the indicators and the price action. If the bulls manage to drive the battle above 1179 (R1), I would expect them to target our next resistance at 1185 (R2). On the daily chart, the move below 1169 (S1) gives a first sign that the overall outlook has probably turned negative. This is also supported by our daily oscillators. The 14-day RSI stands below its 50 line, while the daily MACD lies below both its signal and zero lines.
• Support: 1169 (S1), 1162 (S2), 1153 (S3).
• Resistance: 1179 (R1), 1185 (R2), 1195 (R3).
DAX futures reverse the medium-term uptrend
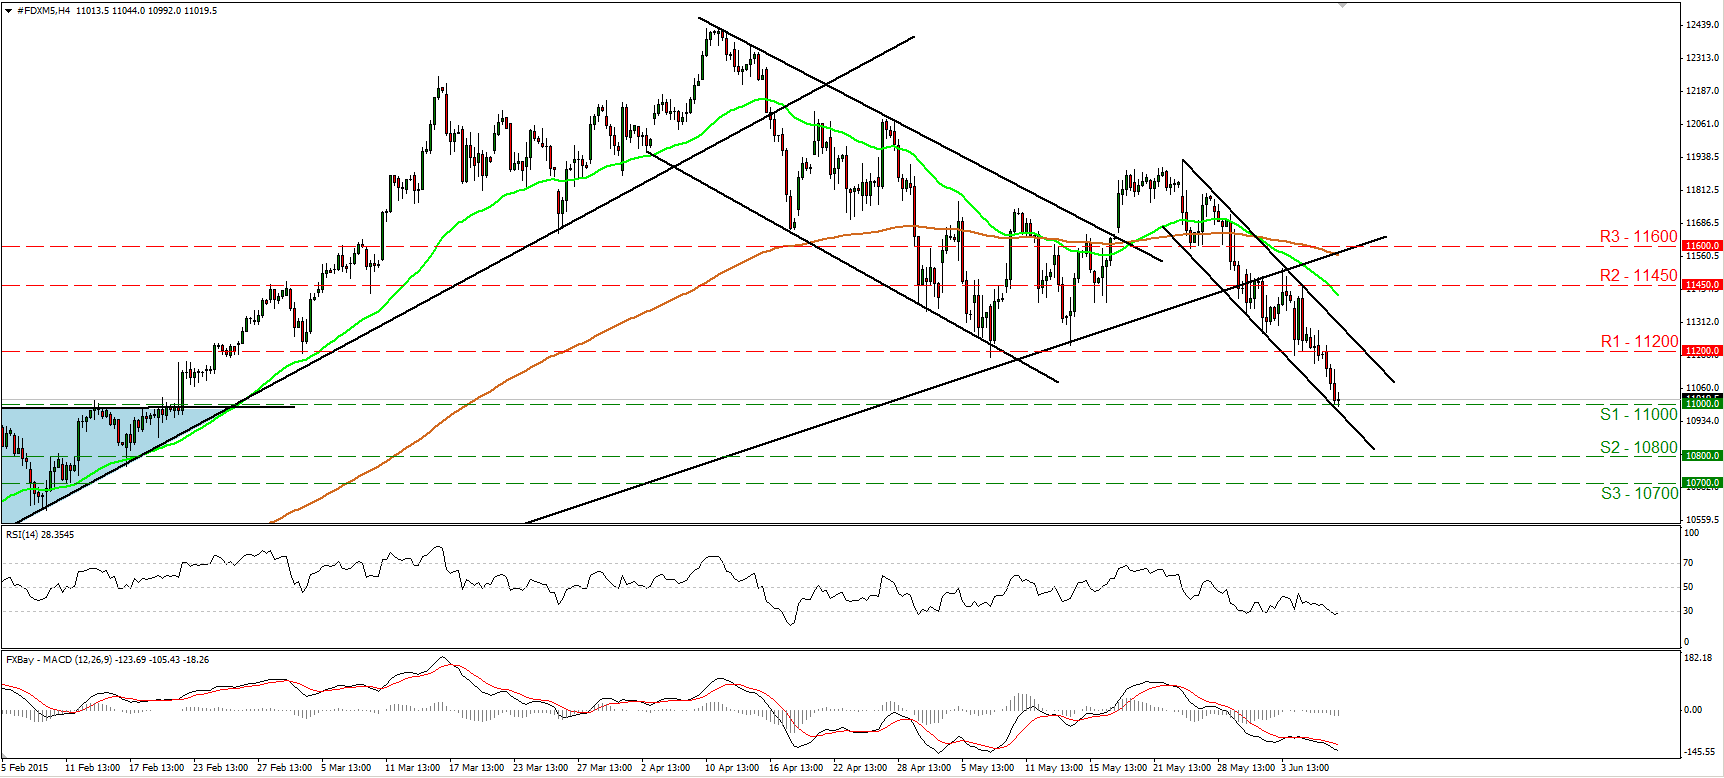
DAX futures tumbled on Monday and managed to reach the key support line of 11000 (S1). As long as the index is trading within a short-term downside channel, I would consider the short-term outlook to be negative. A clear move below 11000 (S1) is likely to see scope for larger declines, perhaps towards our next support area of 10800 (S2). Our short-term oscillators reveal downside momentum, but I also see signs that a corrective bounce could be on the cards before the bears take charge again. The MACD stands below its trigger and well below its zero line, while the RSI looks able to move above 30, hinting the possibility for the aforementioned bounce. As for the longer-term trend, on the 2nd of June, the price violated the uptrend line taken from the low of the 16th of October, while yesterday fell below 11200 (R1), signaling a forthcoming lower low on the daily chart and a possible medium-term trend reversal in my humble opinion.
• Support: 11000 (S1), 10800 (S2), 10700 (S3).
• Resistance: 11200 (R1) 11450 (R2), 11600 (R3).

