IPOs Remain At Historic Lows In Q3 by Andrew Birstingl, Research Analyst – FactSet
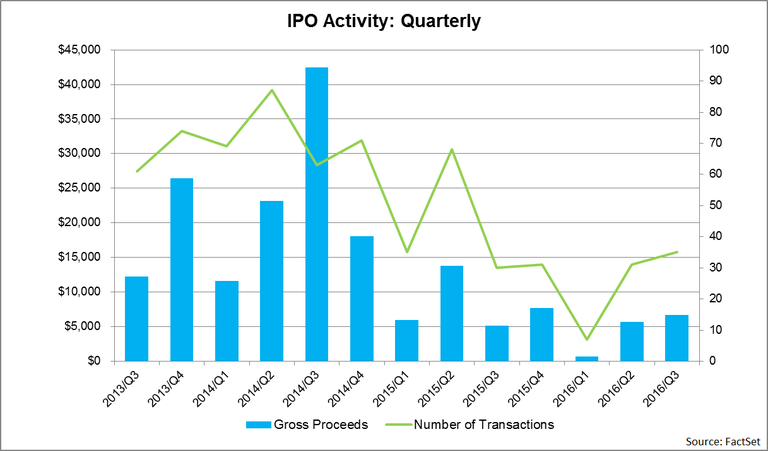
The number of companies going public on United States exchanges amounted to 35 in the third quarter, which represented a 16.7% uptick from the year-ago quarter (30 IPOs). Despite the increase, this number still trails the average third quarter IPO count going back to 2000 (39 IPOs). The Q3 amount also represented an increase from the 31 companies going public during Q2. During the first three quarters of this year, the number of initial public offerings stood at 73, which was a 45% decline from the same time period a year ago. This marked the lowest IPO count through the first three quarters of a year since 2009, when only 33 firms went public.

Gross proceeds (including over-allotment) from initial public offerings increased 29.4% year-over-year in Q3 to $6.7 billion. This value still lags the average third quarter gross proceeds total going back to 2000 ($10 billion). Similar to IPO volume, gross proceeds from initial public offerings through the first three quarters of 2016 ($13.1 billion) marked the lowest value since 2009, when the aggregate amount raised stood at $9.4 billion through Q3. Gross proceeds through the end of Q3 also marked a 47.6% decline compared to the same time period a year ago.
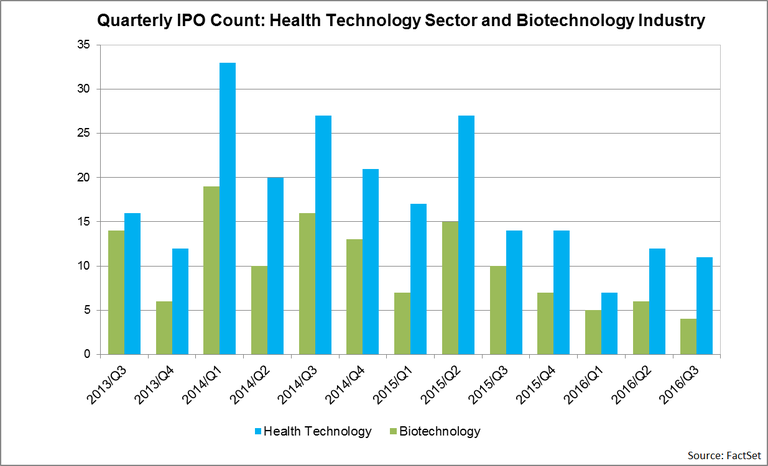
Health Technology Continues to Dominate IPO Volume
Of the 35 initial public offerings in Q3, 11 came from the Health Technology sector, which was the highest representation of any group. The third quarter marked the 11th consecutive quarter that the Health Technology group led all FactSet sectors in IPO volume. Looking at IPO volume this year through the end of Q3, 30 of 73 companies going public were part of the Health Technology group, with half of those coming from the Biotechnology industry, and another 40% coming from the Major Pharmaceuticals industry.

Despite the Health Technology sector clearly dominating in terms of the number of IPOs this year, the year-to-date volume is nowhere near that of the last two years. During the first three quarters of 2014 and 2015, the number of firms from this group going public stood at 80 and 58, respectively.
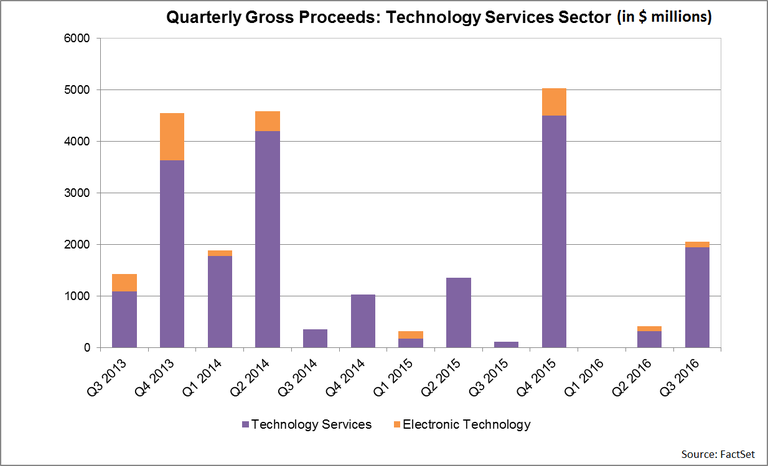
Technology Services Leads Gross Proceeds
During the third quarter, the Technology Services sector led all groups in terms of aggregate gross proceeds from initial public offerings. Gross proceeds from the six IPOs in the sector amounted to $1.9 billion, which represented an uptick from the mere $119 million raised in the year-ago quarter from just a single company.

Line Corp (NYSE:LN) was the top contributor in Q3, as the Japanese tech company raised $1.3 billion for its IPO, more than any other company. This was the largest amount raised by an initial public offering in the Technology Services group since First Data Corp raised $2.8 billion for its offering back in October 2015. Within the sector, Nutanix Inc (NASDAQ:NTNX) was the second major contributor in terms of amount raised. Gross proceeds for the enterprise virtualization and storage solutions provider amounted to $238 million.
