
Rebalancing in one form or another is usually at the heart of success (or failure) in portfolio management. The challenge is distinguishing between those times when the rebalancing opportunity appears comparatively ripe vs. periods when this field is fallow. In a bid to enhance clarity on this critical issue, consider the latest addition to The Capital Spectator’s quantitative toolkit: the Rebalancing Opportunity Index (ROI).
The premise is that tracking the dispersion of performance data among the assets in a portfolio yields valuable perspective for estimating the ebb and flow of rebalancing opportunity overall. As a simple example, imagine a portfolio with just two assets—we’ll call them A and B. In times when the trailing returns are similar for these assets, the implied rebalancing opportunity is relatively weak. By contrast, if the trailing performance spread for the pair is wide, rebalancing’s prospects for the portfolio are considerably more appealing. Therein lies the inspiration between ROI.
Tracking this to and fro of rebalancing’s potential is relatively easy for a two-asset-class portfolio. But as the number of holdings increases, analyzing the related rebalancing opportunity becomes more complicated. Yes, the first order of business is monitoring changes in a portfolio’s asset allocation. But as a supplement for quantifying a portfolio’s overall profile for purposes of assessing rebalancing potential, you can also analyzing the holdings with a metric known as the median absolute deviation (MAD). This is the basis for the ROI data that will show up periodically on these pages, and in every weekly issue of The ETF Asset Class Performance Review, starting with the next issue that will be published this weekend.
Here’s a brief summary of how ROI is calculated and what it’s telling us about rebalancing opportunity. As noted, the engine under ROI’s hood is MAD, a statistically robust measure of dispersion. When directed at the individual returns of asset classes in a portfolio, MAD tells us—in one number—how the range of performance histories compare. It’s similar to standard deviation (volatility), but MAD is less vulnerable to extreme values that can skew the overall results and so it’s superior measure for profiling and summarizing the various return histories within a given portfolio.
The first step in the calculation for the Rebalancing Opportunity Index is calculating the MAD for the portfolio's holdings based on each day’s trailing return histories (we’ll use one-year rolling performance as the standard historical window). Next, we generate the average of those daily MAD calculations for the past year. Now we calculate the ratio of the current MAD number to its trailing 1-year average. The result is multiplied by 100. Finally, we take that number and subtract 100. In other words:
ROI= (MAD daily / 1-year MAD average of daily data * 100) – 100
Plugging in actual numbers, based on the ETF-based version of the Global Market Index (GMI.F) and it’s rolling 1-year return, gives us the following chart. (For a list of component ETFs in GMI.F, see this post.) Notice how the ROI (black line) spiked higher back in May, just before GMI.F’s trailing return fell sharply. As you’ll recall, quite a lot of market turbulence in several asset classes started in May. The fact that ROI climbed sharply was a sign that it was a good time to rebalance GMI.F.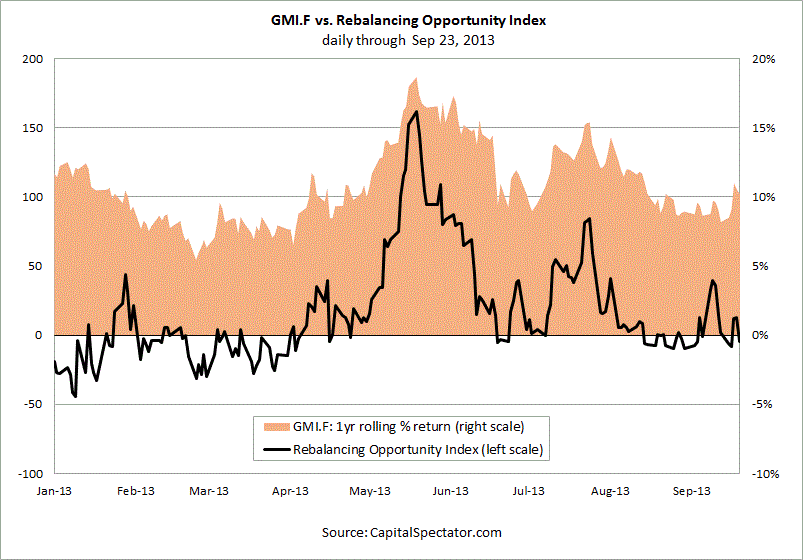
For a longer-term view, here’s how ROI and GMI.F’s rolling one-year return compare over the past decade, this time using monthly data: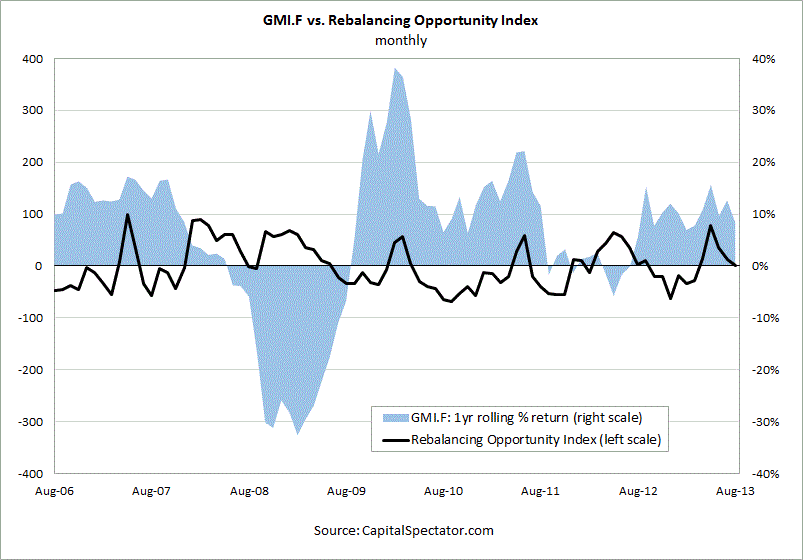
Once again, we see that ROI tends to rise at major turning points for the portfolio, i.e., times when the trailing return is headed substantially lower or higher.
The details on ROI are sensitive to three variables. First, you’ll get different results for different portfolios, depending on the holdings. Second, it’s important to recognize that ROI will vary with the frequency of the performance histories—daily vs. monthly, for instance. Third, different look-back periods for the trailing returns will offer different results.
To keep things simple and intuitive, the standard ROI measure on these pages will be based on daily calculations of GMI.F with 1-year return data. Based on the numbers through yesterday, ROI was -2.27. How should we interpret this number? When ROI is rising sharply, that’s a sign that rebalancing opportunity for GMI.F is also increasing, and vice versa. ROI values at or above 100 looking particularly strong for deciding that rebalancing the portfolio is timely. By that standard, the current -2.27 ROI suggests that rebalancing opportunity is low.
- English (UK)
- English (India)
- English (Canada)
- English (Australia)
- English (South Africa)
- English (Philippines)
- English (Nigeria)
- Deutsch
- Español (España)
- Español (México)
- Français
- Italiano
- Nederlands
- Português (Portugal)
- Polski
- Português (Brasil)
- Русский
- Türkçe
- العربية
- Ελληνικά
- Svenska
- Suomi
- עברית
- 日本語
- 한국어
- 简体中文
- 繁體中文
- Bahasa Indonesia
- Bahasa Melayu
- ไทย
- Tiếng Việt
- हिंदी
Introducing The Rebalancing Opportunity Index
Published 09/24/2013, 07:06 AM
Updated 07/09/2023, 06:31 AM
Introducing The Rebalancing Opportunity Index
3rd party Ad. Not an offer or recommendation by Investing.com. See disclosure here or
remove ads
.
Latest comments
Install Our App
Risk Disclosure: Trading in financial instruments and/or cryptocurrencies involves high risks including the risk of losing some, or all, of your investment amount, and may not be suitable for all investors. Prices of cryptocurrencies are extremely volatile and may be affected by external factors such as financial, regulatory or political events. Trading on margin increases the financial risks.
Before deciding to trade in financial instrument or cryptocurrencies you should be fully informed of the risks and costs associated with trading the financial markets, carefully consider your investment objectives, level of experience, and risk appetite, and seek professional advice where needed.
Fusion Media would like to remind you that the data contained in this website is not necessarily real-time nor accurate. The data and prices on the website are not necessarily provided by any market or exchange, but may be provided by market makers, and so prices may not be accurate and may differ from the actual price at any given market, meaning prices are indicative and not appropriate for trading purposes. Fusion Media and any provider of the data contained in this website will not accept liability for any loss or damage as a result of your trading, or your reliance on the information contained within this website.
It is prohibited to use, store, reproduce, display, modify, transmit or distribute the data contained in this website without the explicit prior written permission of Fusion Media and/or the data provider. All intellectual property rights are reserved by the providers and/or the exchange providing the data contained in this website.
Fusion Media may be compensated by the advertisers that appear on the website, based on your interaction with the advertisements or advertisers.
© 2007-2024 - Fusion Media Limited. All Rights Reserved.