Diversified investors have had to endure a decade of subpar performance from their international stock holdings. The S&P 500 has annualized returns of 9.00% over the last 15 years while the total international stock index has returned 5.7% yearly.
That extra 3.3% may not sound like much but it adds up over time. A $100,000 investment in the S&P 500 in 2005 would be $364,248.25 today, while the same $100,000 investment in the total international stock market fund would be worth $229,567.39.
That’s $134,567.39 left on the table – or 58% – which has many investors either losing their patience or fleeing the space altogether.
I’m an advocate for diversification for risk management purposes. But investors have to understand that diversification isn’t about maximizing returns. Being diversified means you’ll always own some assets that are performing poorly at times. Hopefully those poor performers will eventually turn into stars again, like what often happens. Piling into everything that is working best today is a sure fire way to get burned down the road.

However, the purpose of this post is not to talk about international investing. I’d rather talk about an often overlooked part of market returns – earnings growth. As I’ve stated before, stock prices are a function of interest rates and earnings. That’s why most of the noise you hear in the media should be treated as entertainment only.
The formula for stock returns is Dividends + Earnings Growth + Change in Valuation (sentiment-driven).
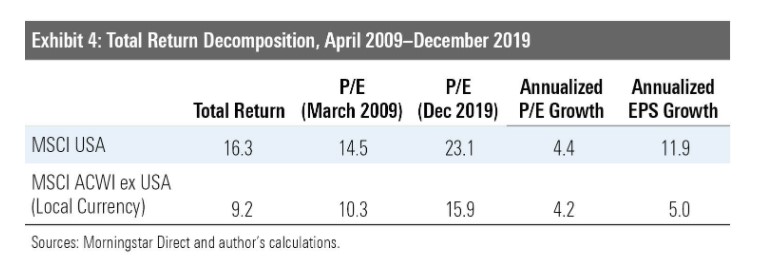
Morningstar recently came out with an article diving into the international stock topic. Citing many of the often-repeated explanations for the poor performance, their conclusion is the biggest factor was earnings growth – or lack thereof – when compared to US stocks.
The chart above shows annualized Earnings Per Share grew 11.9% for US stocks over the last 10 years, compared to only 5.0% for International stocks. That’s the simple explanation for the superior performance.

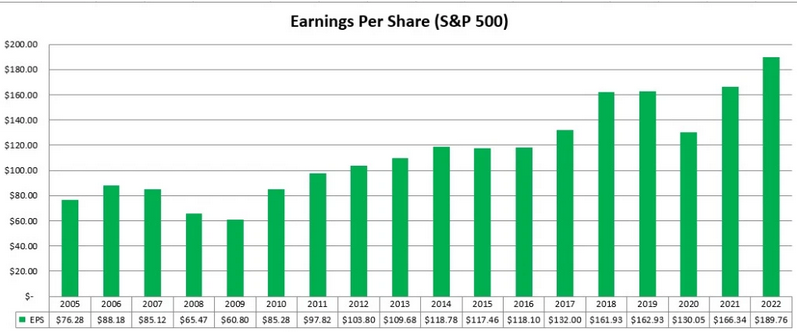
I often hear about how this entire market rally is Fed manufactured. Don’t get me wrong, ZIRP and QE have been a contributing factor. But let’s not forget the EPS on the S&P 500 went from $60.80 in 2009 to $162.93 in 2019. That’s an annualized growth rate of 10.36%.
Per our equation, let’s add about 2% for annual dividends and you get 12.36%.
The actual S&P 500 returns from 2009 – 2019 are 15.11% annualized. Which means the actual valuation boost was approximately 2.75% a year. Which seems relatively modest given the 0% rates for most of the decade and unprecedented QE.
My point is the stock market rally has more to do with actual earnings growth for S&P 500 companies than anything else. And so it doesn’t surprise me at all to see this as the main explanation for US stock out-performance versus the rest of the world.
In regards to International stock investing today, there appear to be two schools of thought.
- Get rid of them altogether (100% US stocks) for a variety of reasons
- Overweight International now because of cheaper valuations and higher dividend yields
I don’t advocate 100% US stocks despite their earnings growth. International stocks have diversification benefits such as if the US dollar declines in value. And we can always look to the lost 30 years for Japanese investors as proof that 100% domestic allocations can be risky. Imagine 30 years and you still haven’t made any money?! Only thing that saved those investors would be if they diversified globally. Could that happen here? Seems unlikely, but you can’t rule it out. Hence, Globally diversified portfolios.
But I really want to address the 2nd point. Refer back to the first chart. The PE for International stocks was 10.3x versus 14.5x for US stocks in 2009. That means International stocks were 40% cheaper than US stocks in 2009, yet they still lagged US stocks quite dramatically over the next 10 years.
Fast forward to today, the forward PE for US stocks is around 23.1x while international stocks are 15.9x. International stocks trade at a 45% discount based upon PE today, compared to the 40% discount in 2009. Not much of a difference is it?
International stocks probably won’t outperform US stocks over the next 10 years just because they are cheaper. The real path towards superior performance would be if their earnings start growing at a faster rate than the US. To this, I have no special insight. People have been predicting value and international out-performance for years to no avail. It will happen eventually. Nothing lasts forever. That much I’m certain of.
