We look forward as traders, not backwards, but it seems we can almost turn a page on this week and look for markets to ramp back up after US Thanksgiving and Black Friday.
Indeed, if I look at moves overnight as a guide for what we can expect over the coming two sessions, we saw a reasonably upbeat move, with the high yield-investment-grade credit spread narrowing seven basis points. This fuelled a decent move in US small caps with the Russell 2000 setting up a decent double bottom, while tech stocks finally caught a bid. Large caps did very little, with the Dow Jones index completely unchanged, although I was somewhat enthused that Caterpillar (NYSE:CAT) outperformed here.
The move in credit and equity was handed a further tailwind from the complete lack of life in rates, FX and fixed income markets. Consider that these markets had a war on two fronts, with MNI (Marketnews), citing a senior Fed officer and suggesting we could see a pause in the Fed’s rate hike cycle in Spring 2019. At the same time, US data flow gave us a further chance to hone in on some of the suspect parts of the US economy. That being, existing home sales, which are growing at the slowest pace since 2014. Core CAPEX orders declined 2.9% YOY, and we still have to factor the decline in the oil price, and therefore the November print promises to be ugly. Nondefense capital goods orders were unchanged for the third month, while durable goods had the biggest fall (-4.4%) since July 2017.
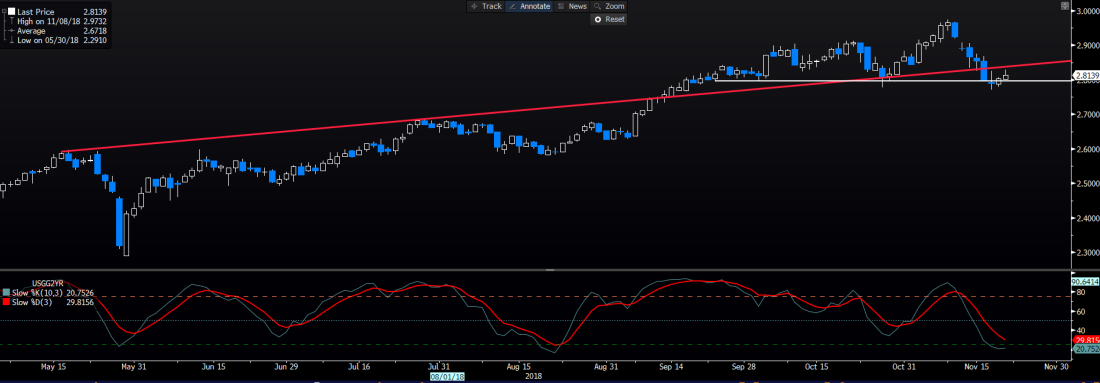
On any given day we should have seen a genuinely solid bid in US Treasuries (across the curve), with rates markets further pricing out future tightening from the Fed. But as it turns out, markets were calm. In fact, we even saw implied volatility fall in most markets and as you can see from the chart of US 2- and 5-year Treasuries, which of course mirrors the change in policy expectations, but the bulls just don’t have the clout to push either market through key support levels (or resistance in price). When we also heard from Foxconn, one of the most leveraged companies to Apple’s iPhone sales, saying they were cutting $2.9b in costs, and I’d argue in days gone by that US tech would have been 2% lower on this story alone.

The USD should have been 0.5% lower on these dynamics, with USD/JPY eyeing a re-test of Tuesday low of 112.31, which seems punchy given USD/JPY 1-week implied volatility suggests a move of 75-pips over the next seven days. But as it is, we see this pair holding the 113-handle.
Logically, it seems markets will likely see two more days of similar moves and come back focused on taking on the challenge of the event risk next week. So, with US data rolling over a touch, and interest rate pricing having already viciously reacted to a more nuanced tone from key Fed personnel, such as Chair Powell and Vice-Chair Clarida, one asks what more we can learn from Fed speakers next week. And, the calendar is littered with key Fed speakers next week, and naturally, the market will be hanging off their every word, as a March hike is currently priced at less than 50%.
Recall, there may be concerns in housing, auto’s and now the forward-looking CAPEX estimates and that suggests Q4 GDP, when released on 31 January, could be closer to 2.5% and certainly lower than the 3.1% consensus growth rate. However, not everything is falling apart and while the fed funds are still some way below the neutral rate, which is considered to be 3% and growth is 70bp above trend, and we could be some 100bp below what the Fed consider as full-employment in 2019, then there are reasons to think the Fed will perhaps not pause in spring. This dynamic is incredibly interesting, as the Fed will have to get this right or markets will sense a policy mistake, especially when liquidity is falling and as prominent strategist David Rosengren pointed out, the global monetary base is running at a -7%YoY rate.
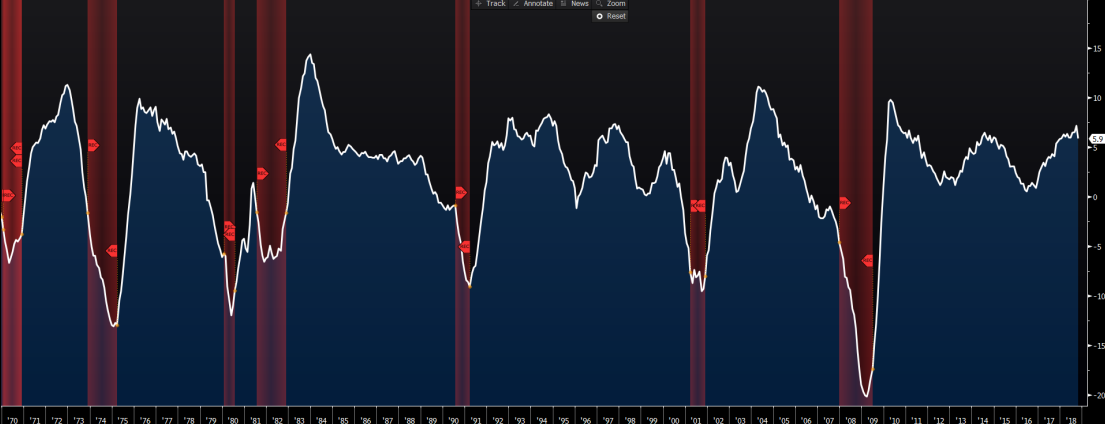
I will be watching US leading indicators as a precursor of a further recession, as this incorporates 10 of the key forward indicators and have been a good litmus test of past recessions.

FX markets have done little through Asia today as well, with AUD and NZD seeing the most protracted move, although a 0.2% and 0.4% fall on the session (against the USD) is unconvincing. The 20-day MA has been good support in AUD/USD since the explosive rally on 1 November, and we can see volatility increase as the Bollinger bands widen. There has been little in the way of news flow through Asia, with the only real data coming in the shape of Japan CPI (ex-food) coming in as expected at 1%, while the weekly MoF (Minister of Finance) showed Japanese funds bought ¥245b of foreign stocks last week, while selling ¥145B of foreign bonds. The move lower in AUD/USD seems a reflection of the correlation with Chinese markets, where we can see the Hang Seng and CSI 300 lower by 0.2% and 0.7% respectively.
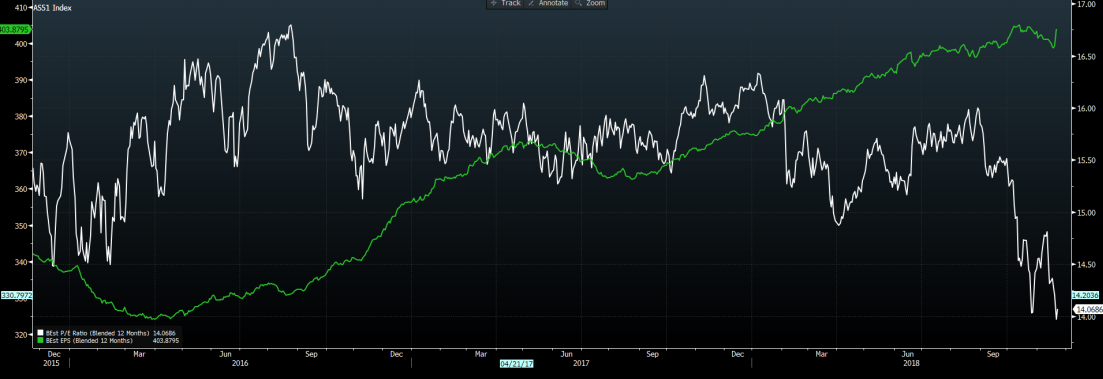
The ASX 200 has been the outperformer here, with the 0.7% gain eclipsing the Nikkei 225, which is up 0.2%. The daily chart of Aussie SPI futures has worked a dream, and the buy zone of 5620 to 5600 held again beautifully. Valuations have been talked up of late, with the ASX 200 trading on 14x forward earnings – the lowest multiple since 2014, falling from 15.9x in October. Earnings haven’t been revised lower to any degree, so value investors are eyeing the market with interest again and centred most of the buying in healthcare. I still feel with liquidity falling and the macro uncertain; the market will see real ‘value’ emerge at lower levels here and award a far higher risk premium than we have seen in years gone by.
Green line - consensus ASX 200 forward EPS, white - consensus 12m P/E

GBP is the currency to watch through the remainder of the week, although there are still unsolved issues in Italy that will affect the MIB and EUR, GBP looks like the currency that could move most aggressively. GBP/USD 1-week implied volatility (vol) had pulled back from the lofty 16% seen last Thursday, but we have seen the market start to pay up for volatility today and vols are pushing higher again. An implied vol of 11% gives us an expected move of 180 points over the coming seven days, which suggests the market sees GBP/USD up to 1.2960 or down to 1.2600.
That feels a touch low in my opinion, with the chain of events unfolding over the next few days and culminating in the EU Summit on Sunday. Anyone variable could derail the Summit, starting with an expected revised draft Withdrawal due tonight, that needs to strike the right balance to get the DUP Party back on side. We are even hearing France and Germany are not aligned in their views on Brexit, and the summit could be called off on their disagreements alone. The risks to the GBP are symmetrical here, but it promises to be an interesting ride for those interest and trading Brexit.
