It’s a tough gig being a trader at any time, but when the clouds of uncertainty loom large and uncertainty keeps the risk takers out of markets, then the short sellers have a far better time.
S&P 500 implied volatility (vol) remains above 20%, and that equates to an implied move of around 40 S&P 500 points a day, or 414 points in the Dow Jones index. Of course, volatility is directionally agnostic, so in theory, we can still see whippy moves in either direction, and 20% feels like the correct implied vol to ascribe to a market still exploring so many changing thematic’s. Importantly, we are not seeing anywhere near the same sort of volatility in FX markets, well, that is outside the GBP, and the USD index is fighting its own battles, where there are signs the September rally could be coming to an end.
Flip the USD index to a weekly chart, as this gives us a strong oversight on the set-up and price action (flow), and we can see price moving outside of the bullish channel that has been in place since September. Momentum oscillators look like crossing lower, but whether price can close the week through the channel is what I am really focused on. Should this development play out, then my cautious, yet positive view on the USD will turn to neutral, while a subsequent weekly close through 95.60 and I will turn selectively bearish on the USD. So, this chart, while predominately focused on the EUR, is a must-watch and will define a lot of my views in G10 FX.

In some capacity, the drawdowns we are seeing in US tech will influence the USD. Not just because of a spike in concerns around supply chains and the impact on US CAPEX and future GDP reads. But global money managers have been all over US tech, and this explosive drawdown is partly explained by a huge concentration risk, with funds not adequately reducing the variability in their portfolio. One could argue that through this liquidation a decent percentage of this capital might flow offshore, although there aren’t many other global equity markets that look wholly appealing either!
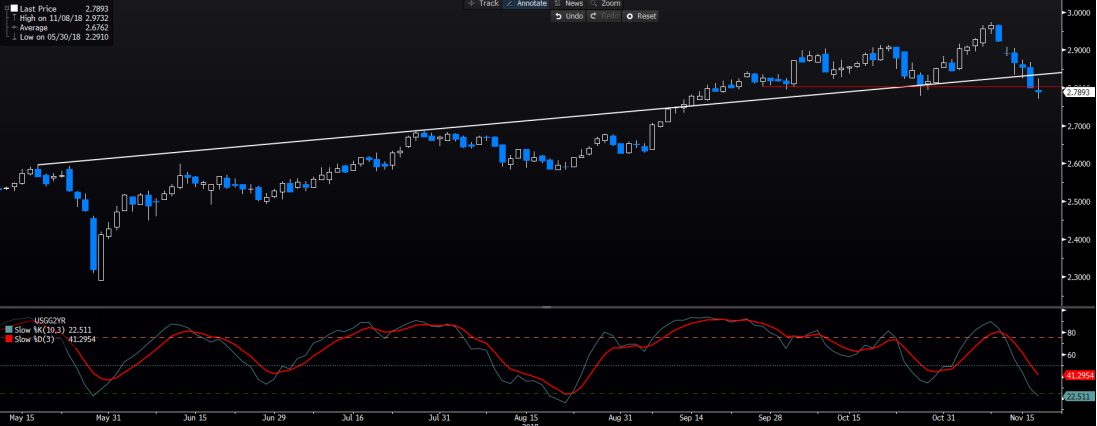
2018 has been a wild ride and in Q1 the talk of global synchronized growth morphed into one of desynchronization in global growth, with the US an island on its own. With many questioning the US economy it feels like we close out the year viewing something more akin to synchronization in a global slowdown, although its a steady grind and not a collapse. US Housing data rolls in again tonight with October housing starts and building permits both due at 00:30aedt and weak numbers here will only add fuel to the spreading fire. As detailed yesterday, there has been a strong re-pricing of US rate expectations over the coming two years, and while one immediately looks at the interest rate futures, we can see the US 2-year Treasury (see below) at a make-or-break juncture, and if the buyers kick in from here and I am targeting 2.60% to 2.55%.

The argument to promote this move would be a genuine feel that after the December rate hike, there will be an extended pause and an active debate that March is off the table. In FX, USD/JPY is the most correlated to moves in the US bond market and a move to 2.60% should see USD/JPY head towards 111.50.
We can also see the impact of a higher VIX index resulting in a strong outperformance from value over growth factors. This suggests signs of switching, but on the whole, the moves in tech could be telling a worrying macroeconomic story. It feels like there are just no buyers of this sector right now and volumes are low anyhow ahead of Thanksgiving.
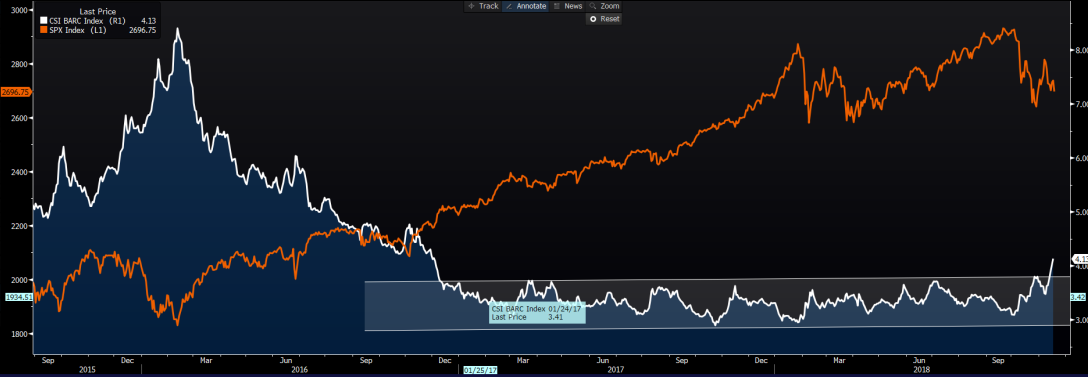
Credit markets have rightfully taken its place as the key driver of equity markets, and while I have periodically put out charts on credit spreads to keep an eye on, we are now seeing multi-year ranges broken and equity taking its cues from the moves. We can look at the high yield credit index (white line) and the spread over US Treasuries (or the so-called risk-free rate) and see this has well and truly broken out. While the rate of change is key here and that is increasing to the upside.

We can also look at high yield spreads over Investment-grade credit and see this showing the same picture. The S&P 500 still has some catch-up to go, so its hard to think we are going markedly higher, and as said yesterday, calls that the highs have been set for the year look ever more certain.
On the whole, Asian markets have found sellers easy to come by today, with China the underperformer with a 1.9% selloff. The ASX 200 sits -0.8% lower, with financials and healthcare taking out the points, although all sectors are lower on the day, with volumes in-line with the 30-day average. Aussie SPI futures have to be on the radar, with price eyeing a move into a huge horizontal support zone seen between 5620 to 5600. For ASX 200 traders, this chart matters greatly, and after a number of attempts to break this floor, the question we want to know is whether this time is different. A break and its goodnight Irene.

AUD/USD has traded a tight range today, and we can see indecision in the daily candle. My throwaway soybean model reacted, as expected, to Mike Pence’s aggressive stance on trade, with the premium to buy Brazilian soybeans increasing a touch over US soybeans. AUD/USD pulled below the 73c handle, which I will monitor, as a daily close below 0.7304 and the top of the cloud at 0.7247 could come into play. Today’s RBA minutes didn’t provide too much new news, and their optimistic tone remained as is, refraining to go into the color many economists would have liked to hear, given the changes in both domestic and international economies.
