In other GBP crosses, we have seen interest to buy EUR/GBP into 0.8680, but trading EUR from the long side is somewhat brave, and more work needs to happen here to feel longs have real promise. The first target is for a move through the 0.87, and that seems tough with German Q3 GDP due at 18:00AEDT (consensus -0.1%qoq) and the Italian budget talks in play, with the Italian government standing firm on its growth targets and even asking the EU for leeway. The talk is Italy will be handed an Excessive Deficit Procedure (EDP), which will largely be aimed at fines and one questions if this backfires and provides fodder for the anti-EMU parties ahead of the European elections in May.
AUD flows have been mixed and not helped by a weak feel to Asian equity markets, with China and Hong Kong modestly lower. AUD/NZD has been on the radar for a while and is my preferred vehicle for expressing a bearish view on the AUD, with price breaking to the lowest levels since April and trending well. China data has not helped the AUD broadly, with a decent miss in October retail sales (8.6% vs 9.2% eyed), although industrial production and fixed asset investment both slightly beat consensus expectations. However, when we combine these metrics with the sharp drop in yesterday’s October money supply number then this data will not do any favours to growing concerns around global growth. Japan’s 1.2% (annualised) qoq GDP contraction of 1.2% will only add fuel to this camp.
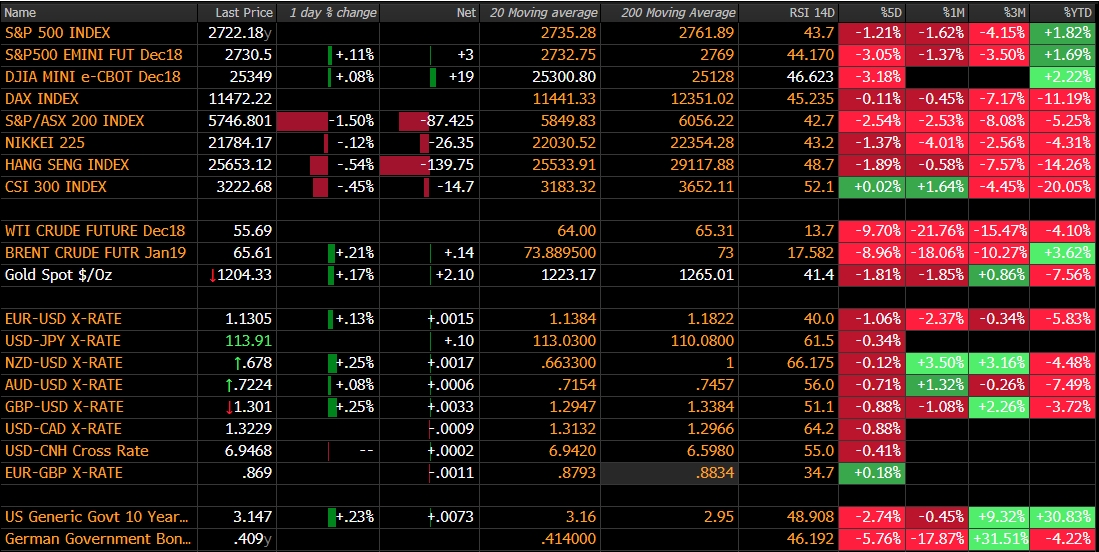
The ASX 200 is the laggard, -1.5%, with financials and materials accounting for 49-index points and we see a heavy feel here. I have turned to Aussie SPI futures to give oversight on the ASX 200, and the daily (or weekly) shows such clear battle lines – there is huge support into 5600, while it is hard to have a bullish bias until we see the double top being taken out at 5930 - see chart below.

Back on the AUD, and the data flow has given the AUD bulls some scope for encouragement, but not a lot, and we can also see 3-year Aussie bond yields completely unchanged at 2.08% on the day. It’s hard to believe Aussie consumers were more confident during November, with Westpac Confidence report increasing 2.8% in November, although the market gave this a big swerve, with AUD/USD moving a whole six-pips in the five minutes post the data release. As expected, Aussie Q3 wages increased 20 basis points to 2.3% YoY, which is still the strongest level of wage growth since 2015, but well shy of the 3.5% growth Governor Lowe recently identified as a target – keep in mind that should wage actually get to 3.5% it would be the strongest level of growth since December 2012, and naturally the cries of rate hikes will be more pronounced.
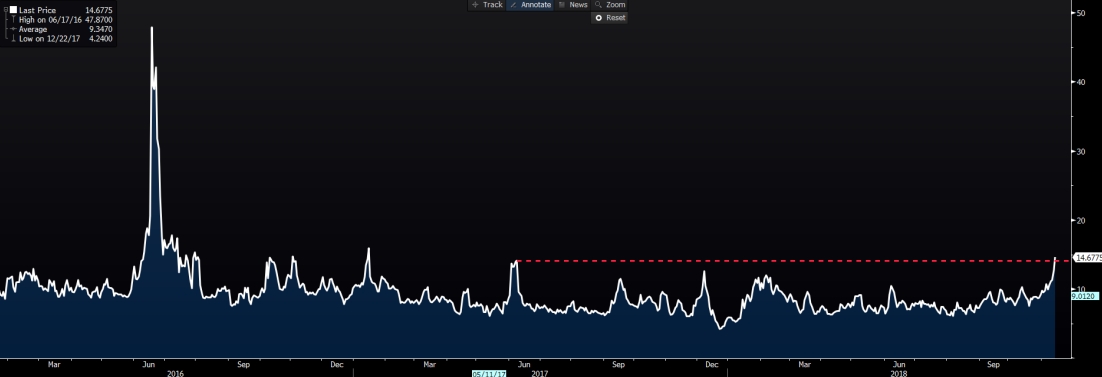
The other major talking point remains squarely on oil prices, with WTI implied volatility spiking to 50% and the highest levels since December 2016, while many have pointed out that the 9-day RSI sits at a lowly 6, and has never been lower.
The weekly chart of crude shows the broad structure and the clear break of the bullish channel that has been in place since 2016, while the price has closed through one horizontal support level after another. We can look at the term structure, and here I have looked at the year ahead (front month minus the 13th-month contracts) to see the spread, and here see an ever-increasing contango, with front-month futures cheapening relative to that of future contracts. The bulls will need to see this structure change, but, if anything it looks like it is getting more pronounced and rallies are a gift and unlikely to be too pronounced.

