Here are a few aspects of the current financial situation that I find interesting:
1) The spread between the 10-year T-Note yield and the 2-year T-Note yield is a proxy for the US yield curve. When this yield-spread is widening, it implies that the yield curve is steepening and when this yield-spread is narrowing it implies that the yield curve is flattening.
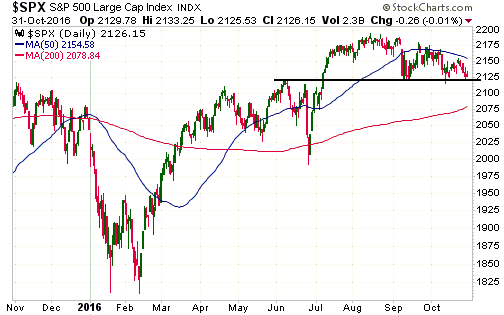
The following chart shows that the 10yr-2yr yield-spread broke above its September high late last week. This is evidence that the US yield curve has shifted from a flattening to a steepening trend, which is a recession warning and a bearish omen for the US stock market. It is also bullish for gold, although the overall fundamental backdrop is no better than neutral for gold.
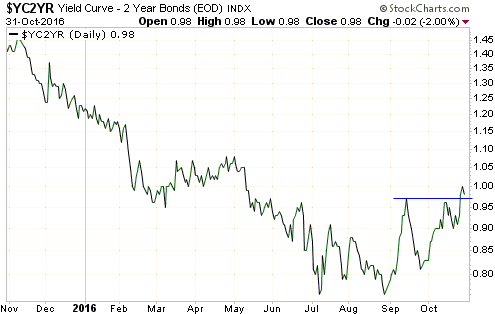
2) As illustrated below, the Dollar Index has been oscillating within a horizontal range for about 20 months. It has worked its way upward since May of this year, but is roughly unchanged since the beginning of the year and is about 2 points below the top of its 20-month range.
The fact that the Dollar Index is roughly unchanged since the start of this year is interesting because the dominant fundamental driver of intermediate-term trends in the US dollar’s exchange rate (the relative strength of the US stock market) has been USD-bullish throughout this year. By rights, the Dollar Index should be well above its current level.
There are two reasons that the Dollar Index is still trapped within its horizontal range. One is that there was a huge sentiment-driven overshoot to the upside during the first quarter of 2015. The other is mentioned below.
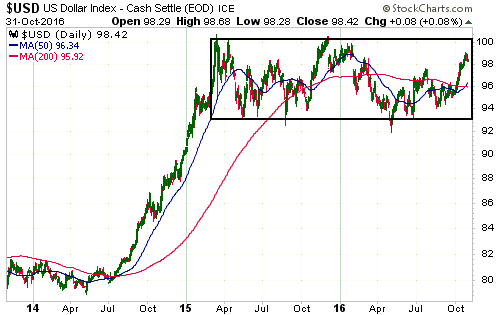
3) The following chart shows the Treasury securities held in custody at the Fed for foreign central banks (FCBs). Not all US government debt securities owned by FCBs are held at the Fed, but more than half of them are and trends in the Fed’s custody holdings should reflect trends in overall holdings.
The chart shows that FCBs stopped being net buyers of US government debt in December 2013 and have been relentless net-sellers since December of last year. This tells us that FCBs have made a concerted attempt over the past 10 months to weaken the USD. This, I suspect, is a reason that the Dollar Index has remained range-bound this year to date despite the upward pressure exerted by USD-bullish fundamentals.
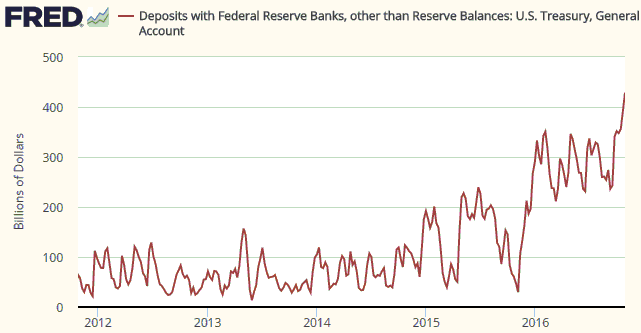
4) The following chart shows the amount of money held in the US Federal government’s account at the Fed. Prior to the past year or so the amount of money in the Treasury’s deposit at the Fed was usually below $100B and had never been more than $200B, but something changed in November of 2015.
Since early-November of 2015 there has been a net addition of about $400B to the Treasury’s account at the Fed. This means that the Treasury has temporarily withdrawn about $400B from the US economy over the past 12 months, an action that is, in effect, a monetary tightening. This action would undoubtedly have slowed the pace of US economic activity.
The Treasury is obviously not trying to reduce the pace of economic activity. Why would it, especially in the lead-up to an election? It is, instead, trying to build-up a larger cash buffer for risk management purposes, possibly in expectation of more inter-party haggling over the debt ceiling.
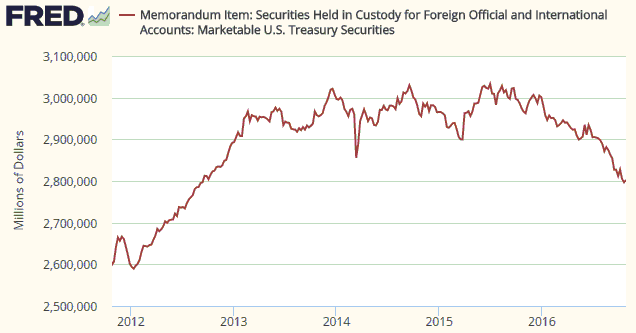
5) The final chart shows that the S&P 500 Index is precariously poised near a technical precipice. A downside breakout will probably soon happen, but until support at 2120 is decisively breached there will be an outside chance of a rise to new highs prior to a tradable decline.
