
September was heralded as the month of decision, and it is right to say that we are almost there, but not yet. Until decisions have been made, gauging the market requires using an internal scope to see how the intermarkets are playing out. The ECB congregates Thursday, and there seems to be some hope that, as limited as it may be, they will make some provisions. The semantics of short term lending and its legality have been thrown around, as well as the ambitions of an unlimited bond buying program. Whatever is to come from Europe is still unknown, but what we do know is that Germany will have its say in the matter.
The Federal Reserve is similarly in the process of triggering QE3 or not. Many believe that the next few weeks of economic data will play a deciding role in the decision, but that may be too rudimentary in thought. Considering stimulus will inevitably lead to price inflation, Bernanke may hold off on directly hitting the consumer. With the fragility of the Middle East and inflation seen in agriculture, the Fed may deem this an inappropriate time to weaken the dollar. The possibility of some other form of obscure easing could also be on the horizon.
Dividend Index
A theme seen throughout the latest rally was the demand of dividend paying instruments. With the seemingly yield-less government debt and fear of risk in particular assets, safer dividend plays were all the rage. The indicator below is that of a select dividend index (DVY) over an equal weighted market index (RSP). What is seen from the ratio is that dividends outperformed throughout most of the rally. This is a sign of defensive sentiment, but later on it saw a steep decline. That sense of waning risk aversion was fairly bullish, but the indicator looks to be consolidating. This is expected prior to market moving releases, similar to what we will be seeing shortly, and could mean pullbacks or further slothfulness from markets.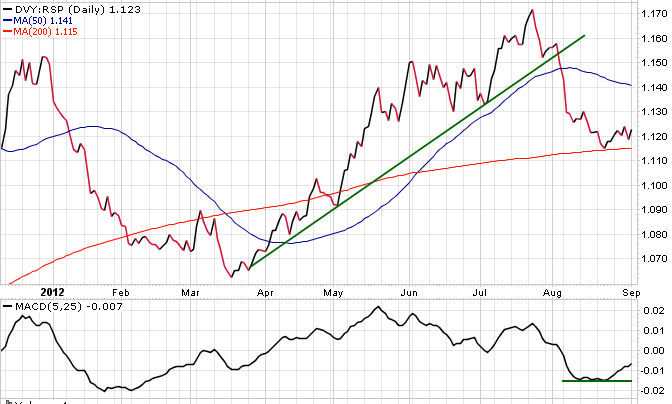
Spain
A fairly positive trend developing is Spanish equities leading world markets. Many of the decisions to be made by the ECB are due to deterioration of confidence in Spain. As confidence falls, their yields appreciate. The indicator below is that of Spanish equities (EWP) over world equity (VT). There has been a solid run up in the price action throughout the last half of the rally, and a slight consolidation as of late. The slight breakout seen below signals confidence that Spain may be better off than once thought. The duration of its current move relies directly on what the ECB decides in following weeks, but this indicator seems to be pointing towards relief in yields.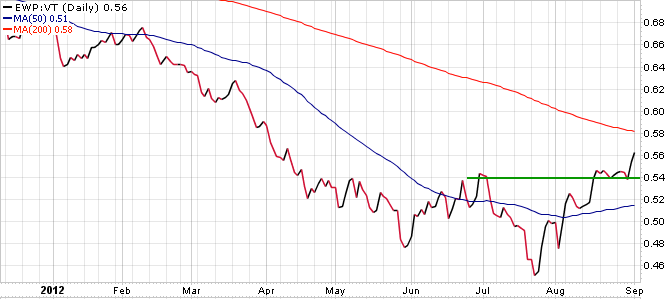
The last macro heavy indicator is that of commodities (DBC) over 20+ year treasuries (TLT). This indicator leads in a stimulatory/inflationary environment, the one in which most market participants hope to see shortly. Whether it is the ECB, Fed, or PBOC that pulls the trigger; this indicator will uptrend. As can be seen, there has been a slight recess in the action recently. Both the price action and MACD have pulled back, but this can be attributed to various factors. The main factor that is trying to be highlighted here, however, is that a risk on environment should trigger upward mobility. Another insight is that this indicator has some room to move lower without breaking any major trend lines. Look for this move lower in following days prior to decisive action.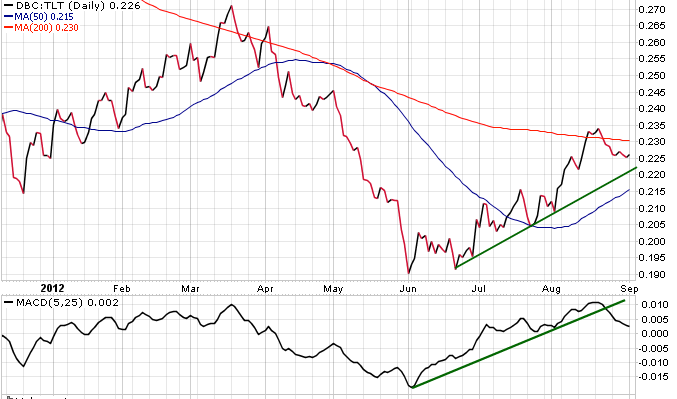
Obscure Indicators
Moving into the realm of a more equity centric point of view, we turn to a few obscure indicators. The first one is the S&P 500 number of issues above their 50 day MA over treasuries. This indicator shows the short term strength of equity markets. As can be seen below this indicator is fairly volatile and has recently receded off of its trend line. This is not to call for a pullback, rather to show that the upward strength is not currently present. Further developments should propel this indicator in a more definitive direction.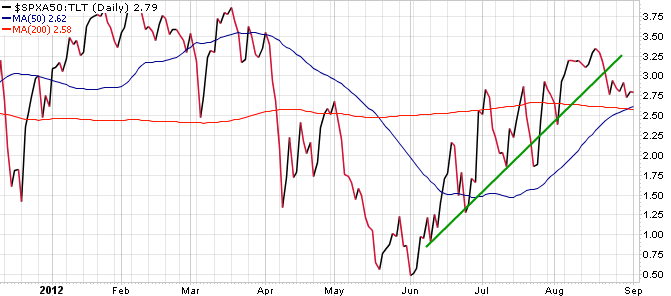
The longer term outlook is shown below in equities. This indicator is that of equities over their 200 day MA's compared to treasuries. This indicator is less volatile and looks to be slightly retracing. It showed strength towards the end of the last rally, but is pulling back before either moving higher, or regressing into the rectangle.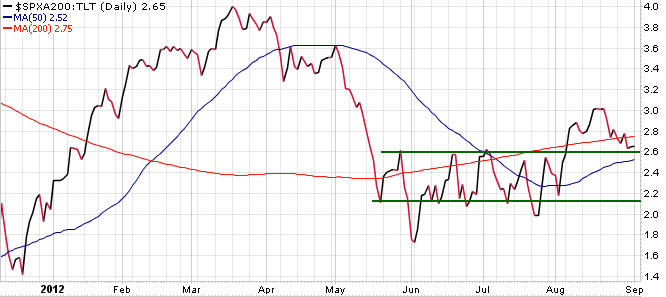
Volatility Indicator
The last indicator is a volatility measure. When markets are volatile and VIX (VXX) is active, utility stocks (XLU) outperform the broader market. This indicator has seen a breakout lower, but is somewhat bottoming at its current levels. There could be a move back up to the rectangle or simply a sideways move. Whatever is the case, strength in this indicator indicates volatility in broader markets.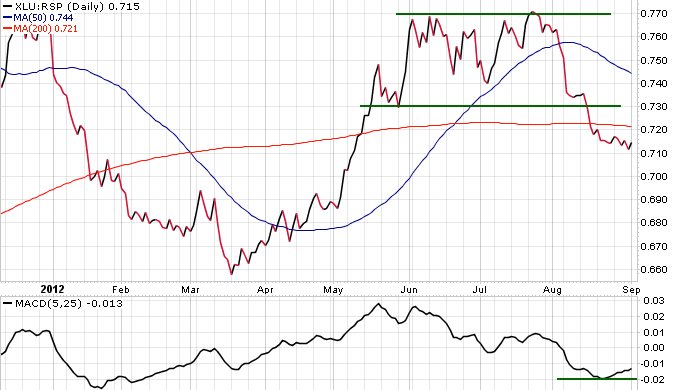
The magnitude of charts is needed at due to a seeming lack of headlines influencing markets. We are at a wait-and-see moment and these indicators confirm that.
- English (UK)
- English (India)
- English (Canada)
- English (Australia)
- English (South Africa)
- English (Philippines)
- English (Nigeria)
- Deutsch
- Español (España)
- Español (México)
- Français
- Italiano
- Nederlands
- Português (Portugal)
- Polski
- Português (Brasil)
- Русский
- Türkçe
- العربية
- Ελληνικά
- Svenska
- Suomi
- עברית
- 日本語
- 한국어
- 简体中文
- 繁體中文
- Bahasa Indonesia
- Bahasa Melayu
- ไทย
- Tiếng Việt
- हिंदी
Indicators Indicate 'Wait And See'
Latest comments
Loading next article…
Install Our App
Risk Disclosure: Trading in financial instruments and/or cryptocurrencies involves high risks including the risk of losing some, or all, of your investment amount, and may not be suitable for all investors. Prices of cryptocurrencies are extremely volatile and may be affected by external factors such as financial, regulatory or political events. Trading on margin increases the financial risks.
Before deciding to trade in financial instrument or cryptocurrencies you should be fully informed of the risks and costs associated with trading the financial markets, carefully consider your investment objectives, level of experience, and risk appetite, and seek professional advice where needed.
Fusion Media would like to remind you that the data contained in this website is not necessarily real-time nor accurate. The data and prices on the website are not necessarily provided by any market or exchange, but may be provided by market makers, and so prices may not be accurate and may differ from the actual price at any given market, meaning prices are indicative and not appropriate for trading purposes. Fusion Media and any provider of the data contained in this website will not accept liability for any loss or damage as a result of your trading, or your reliance on the information contained within this website.
It is prohibited to use, store, reproduce, display, modify, transmit or distribute the data contained in this website without the explicit prior written permission of Fusion Media and/or the data provider. All intellectual property rights are reserved by the providers and/or the exchange providing the data contained in this website.
Fusion Media may be compensated by the advertisers that appear on the website, based on your interaction with the advertisements or advertisers.
© 2007-2024 - Fusion Media Limited. All Rights Reserved.